Discovered Patterns in Numeric Passwords Raise New Questions

Last updated on: September 6, 2020
In my previous article, I showed how a powerful tool like John The Ripper can crack a few million passwords mainly using a dictionary attack strategy.
As pointed out by Jeremi Gosney on the Security Nirvana blog, it is impossible to write a “Top Passwords” post for the LinkedIn breach because the leaked list only contained unique hashes. That being said, through the analysis of password patterns and the discovery of a few common tendencies, we can see how bad humans are at random password generation by focusing on a group of passwords easily cracked by an incremental attack: numbers.
Numeric Passwords
 Numbers are easy to crack, and out of the 6.5 million passwords exposed in the recent LinkedIn breach, I was able to crack just over 200,000 numeric passwords (i.e., passwords consisting only of the numbers 0 through 9). Of those 200,000 numeric passwords, 93,340 contained 6 digits and 55,027 contained 8 digits – roughly 75% of all numeric passwords found.
Choosing a purely numeric password is usually a horrible idea, because even for 8-digit numeric passwords, it only takes a few seconds to generate the SHA-1 hashes for the 100 million (10^8) possible combinations. By comparison, using a combination of lower-case and upper-case characters plus numbers and 10 special characters yields 7.2 * 10^14 possible combinations (i.e., it takes 7.2 million times longer to generate hashes of all possible combinations).
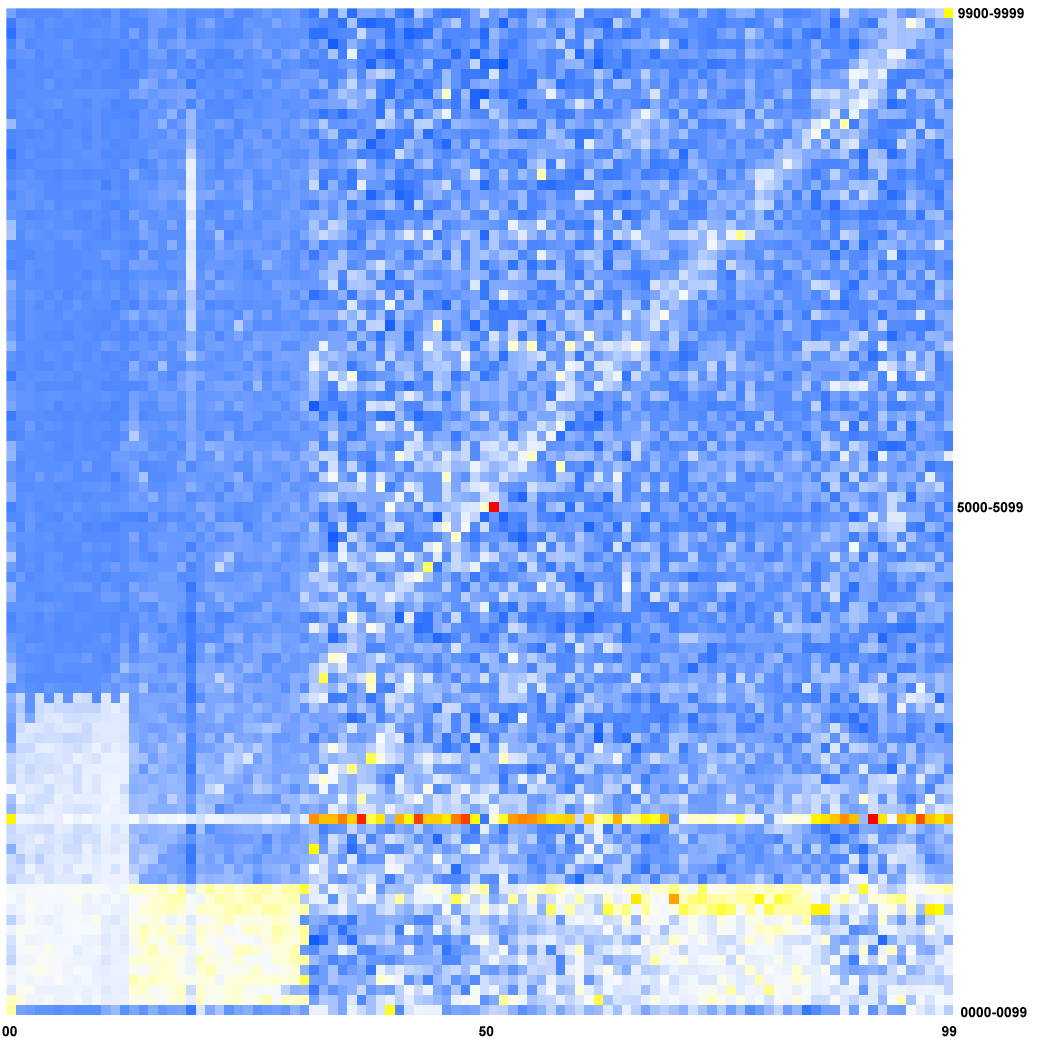
One of the wonderful properties of numbers is how easily they can be represented graphically. As we can’t know which passwords are duplicates, we focused on the distribution of the numerical passwords and chose a method to enhance the patterns.
In the heat map shown above, the 93,340 6-digit passwords that I cracked are represented. The x-axis represents the first two digits from 00 to 99, and the y-axis represents the last four digits from 0000 to 9999. In other words, each column stands for a single prefix (from the left to the right 00-99) and each row represents a “window” of 100 suffixes (from the bottom 0000-0099 to the top 9900-9999). Thus, each pixel of the graphic represents 100 possible passwords.
For example the lower left square represents 000000 through 000099; the square to the right of it represents 010000 through 010099; and the top left square represents 009900 through 009999. The color of each square represents the number of cracked passwords within that range with blue representing very few cracked passwords in that range, and red representing many in that range, as shown in the legend below. Note that the color distribution in the heatmap is not uniform — color values are shifted based on other values in the same row and column to make the patterns more obvious. Heat maps were generated using R.
![]()
Patterns Extracted from Numeric Passwords
If users selected their passwords randomly, then the passwords would be distributed evenly with each pixel representing about 9 passwords (93,340 divided by 10,000 squares for our 100 x 100 heatmap). In this case the heatmap would be a uniform color with some “noise.” However, users don’t select passwords randomly, so we can discern areas with higher and lower concentrations of passwords.
First we spot some boxes on the bottom left corner and two lines: one vertical, one horizontal, which I will discuss later. We clearly see a bottom-left-top-right diagonal that represent the passwords composed from three repetitions of the same two digits : 313131, 424242, etc. If we look into the raw data, we can see that all 100 of them are present (and we can guess that some of them are probably used by more than one LinkedIn user). At this point, any attacker can guess that this pattern is also used for letters, as well (for example, by analyzing the cracked non-numeric passwords, I found 474 of the 676 (26^2) possibilities of lowercase letters like ababab using this pattern).
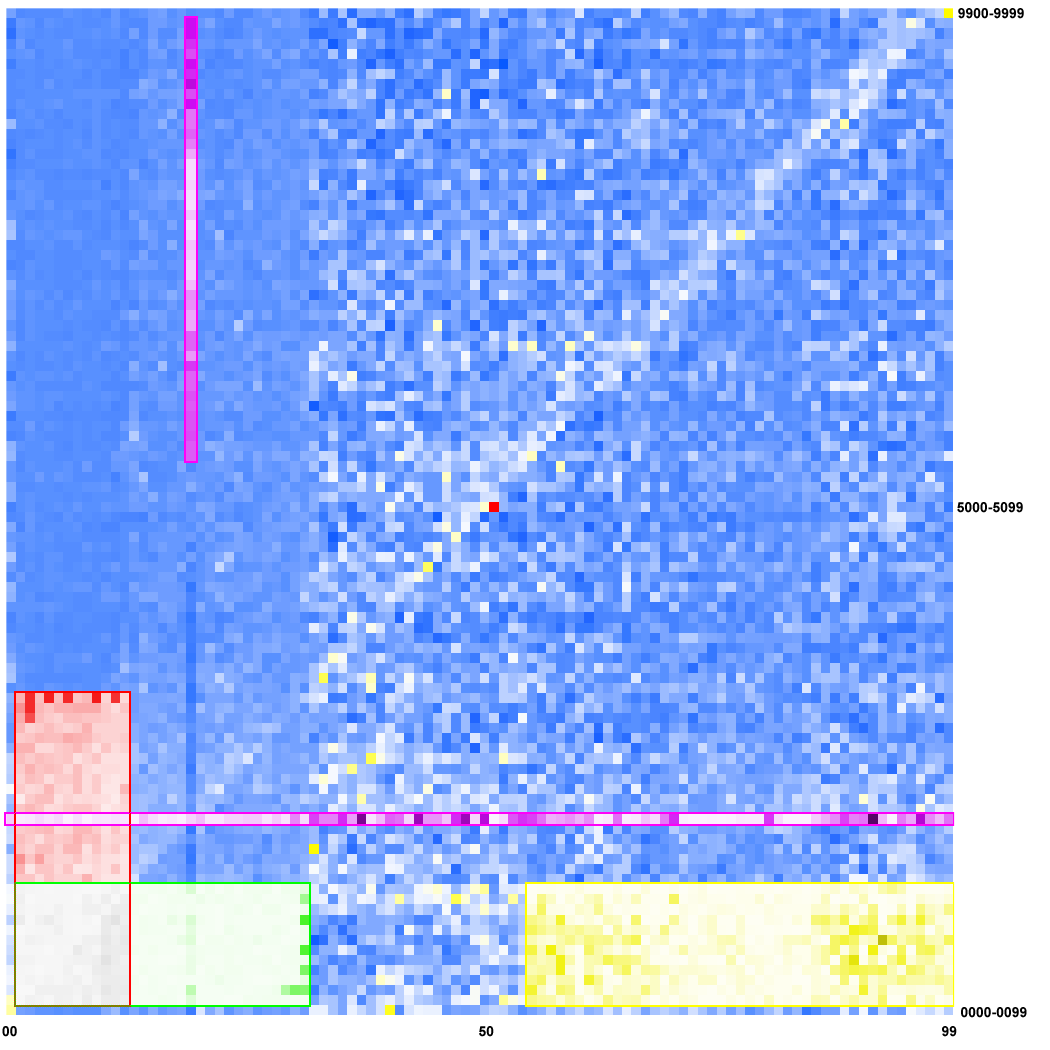 Let’s take a look at the areas and lines in the bottom left zone of the heatmap, and let’s add some color in order to identify them:
In the green area, we can notice all the dates represented as DDMMYY. If we look closer, we can also see the months (rows) with less than 31 days have darker pixels on the 31st column. This also holds true in the diagonally symmetrical red area, which represents MMDDYY. With those two date formats, we can find nearly 40% of the passwords in their corresponding areas, although these cover only 6% of this heat map. The horizontal pink line is composed of numbers finishing with a 4 years digits of the 20th century (i.e., 19xx), and the vertical pink line symbolize the numbers beginning with 1955 up to 1998. The yellow area corresponds to the dates represented as YYMMDD from 1955 to 1999.
When any password specialist sees these patterns through the cracked list, it then becomes obvious to generate a dictionary of dates as more complex strings like “November 4, 2011,” which would have been harder to crack in an incremental mode. Several tens of thousands passwords in that leak are indeed various date formats in various languages.
Spotting Password Singularities While Watching Numbers
It is also possible to represent 8-digit numeric passwords in a heat map, as shown below. The x-axis represents the first four digits from 0000 to 9999, and the y-axis represents the last four digits from 0000 to 9999. To keep the graphic to a reasonable size, we show a 200 x 200 pixel heat map, where each column represents a “window” of 50 prefixes and each row represents a “window” of 50 suffixes. Each pixel of the heatmap then represents 2500 possible passwords.
 Again, the obvious diagonal pattern is any password chosen as a repetition of four decimal digits: 42154215, 36713671, etc. This is also a good pattern for cracking alphanumeric passwords: more than 19,000 passwords, e.g. abc1abc1, follow this pattern in the LinkedIn data.
The yellow area displays every password of the format DDMMYYYY for each year from 1900 to 1999; the small green area shows every password of the format YYYYMMDD. These two little areas contain 25% of the 8-digit numeric passwords.
As I was looking at this heat map, I noticed an abnormal line in the upper right corner (the little pink box on the graphic). At first, I thought it was a 69xxxxxx pattern (users’ affinity for the number 69 is pointed out in a paper on customer-chosen banking PINs), but it wasn’t. After a closer look at the actual values from the cracked passwords, I found a weird range of nearly complete sequential list of 423 numbers from 67108865 to 67108899 and 67109000 to 67109397. At the time of writing this post, I’m waiting for the validation from LinkedIn that the accounts related to this range may have been automatically generated in some way.
Again, focusing on the results of an easy incremental attack of the passwords, we can discover various strategies (word repetitions, date generations, etc.) that can be reused to crack tens of thousands of more passwords, including strong ones, without using rainbow tables or a powerful CPU/GPU. At the same time, we can find that passwords sometimes reveal some secrets (apart from pure demographic analysis that could have been done on birth dates of LinkedIn users), like that bizarrely long list of numerical passwords.
New Questions
The obvious conclusion, which has been repeated many times elsewhere, is that humans are not good at generating secure passwords. No matter how clever we think we are, we always pick passwords based on some reasoning, like the dates or repetition patterns shown above, and that reasoning can be discerned and used to crack the password. Only truly random passwords are safe from this type of method.
Personally, I’m interested in the person(s) who stole and released the LinkedIn data. Hypothetically, if we are able to unveil information from the released password hashes, and if the hashes that have been “marked” with five 0’s in their beginning are those already cracked by an initial hacker, I am wondering if someone would be able to make a profile of this person by looking at the success rate of different hacking methods such as rainbow tables, incremental mode, dictionary attacks and so forth.