Continuous Monitoring for Critical Internal Assets

 When unauthorized or suspicious changes occur on your network or systems, you want to know about them immediately so you can remediate the exposure. Qualys Continuous Monitoring (CM) gives you real-time alerts for critical events on your perimeter systems, and now it does the same for systems behind the firewall as well. Security teams can monitor and get alerted to critical events on desktops, servers and other internal assets as well as Internet-facing devices.
What You Can Monitor
Qualys CM is highly configurable, so you can monitor just the events that are a security risk within your organization. For internal monitoring, we’ve added additional automatic filters to better prioritize alerts for critical high-value events that require immediate response. Triggered events are displayed on the Events Dashboard, and can also be configured to generate email alerts based on additional, configurable rules. Alerts can also be configured to be delivered to SIEM and incidence response management systems using the CEF API.
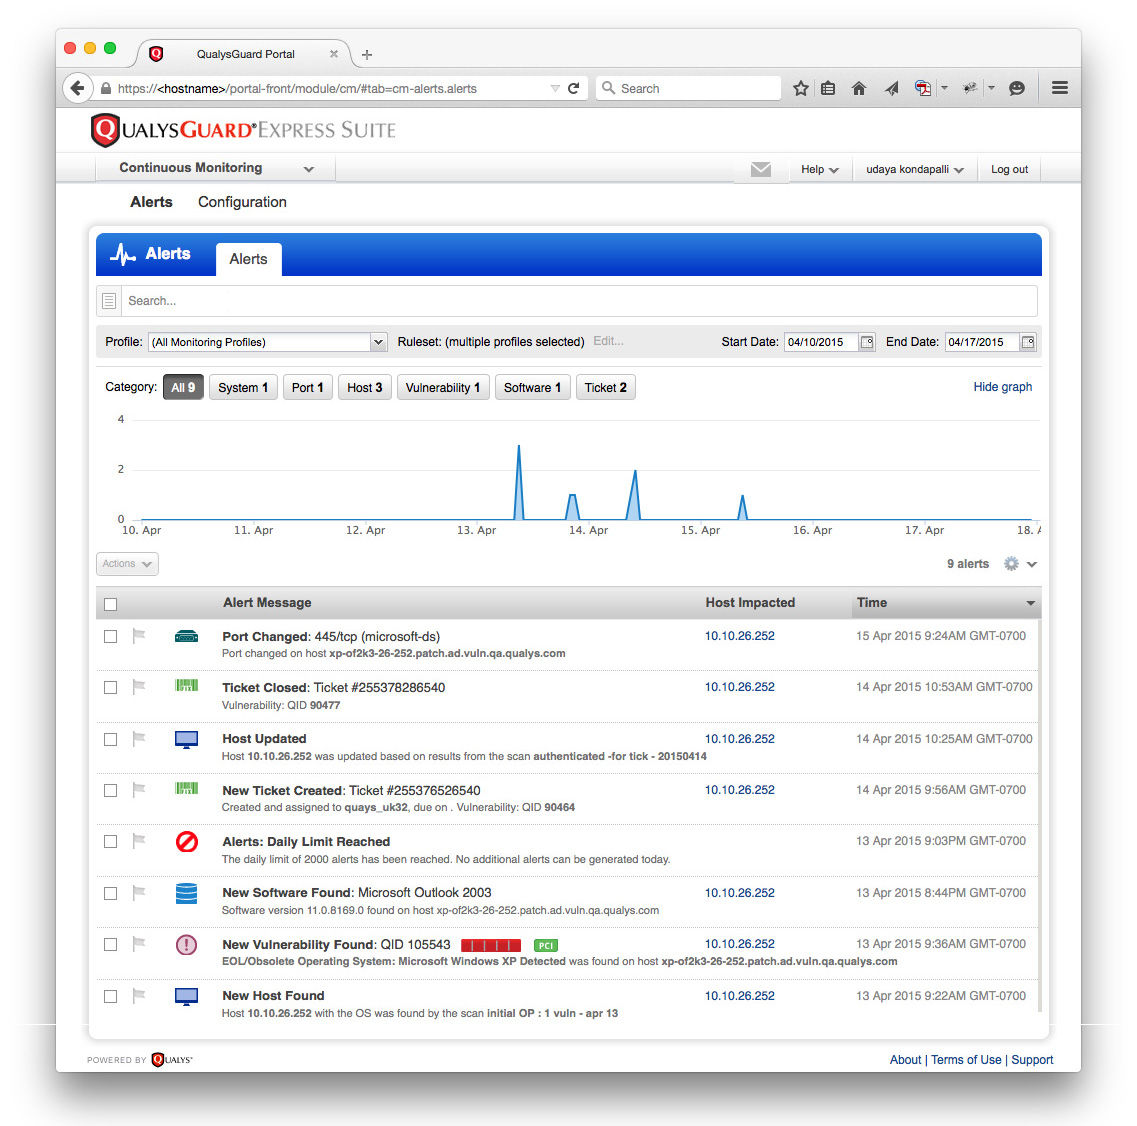
Figure 1 (click to enlarge): Alerts Dashboard shows critical events that security teams want to track.
As shown in figure 1 above, the types of events that can generate alerts for internal systems include:
- Hosts & Devices – see whenever systems appear, disappear, or are running unexpected operating systems.
- Ports & Services – keep tabs on which network ports are open, which protocols are used, and whether they change over time.
- Vulnerabilities on Hosts or in Applications – know when potential or confirmed vulnerabilities appear (or reappear), how severe they are, whether they can be exploited, and if patches are available or if they fail you for PCI compliance.
- Installed Software – find out when unauthorized application software gets installed or authorized software gets removed from these systems.
- Remediation Tickets – get alerts when remediation tickets are opened, resolved or closed, so you can track progress on the most critical issues.
- Digital Certificates – Track your external and internal facing certificates to ensure only certs from approved issuers are exposed. Also be alerted when certificates change or are about to expire.
Why Internal Monitoring
Security teams monitor perimeter systems to get immediate alerts for introduced weaknesses in their defenses so they can shore them up before a breach occurs. A defense-in-depth strategy naturally extends the same vigilance against threats to internal systems as well, to ensure they maintain an appropriate security posture.
Behind the firewall, the three main use cases for continuous monitoring are:
- Change Control: Get real-time visibility into a variety of system changes. Because there are so many controls and filters, administrators receive only the alerts they need and can monitor for specific high-risk changes like network configuration changes that might generate internal access issues.
- Compliance: Complement your policy compliance programs by monitoring and alerting to key compliance variances on your critical systems. Get instant, dashboard-level visibility into compliance issues.
- Attack Protection: In the case of a perimeter breach, exposure of an organization’s proprietary data can occur quickly. By providing a real-time view of the state of internal systems, Continuous Monitoring can immediately notify staff where suspicious changes are happening on internal systems so they can focus their mitigation efforts and reduce damage.
Dig Deeper Into Alerts
Once security teams see an alert, they can go to the Alerts Dashboard to drill into the event for more detailed information, including when and where it occurred and what changes were involved.
Security teams can also drill into the host where the alert was reported and see all other alerts across that host, to help them correlate multiple alerts related to a single root cause. Host-level data available includes:
- Vulnerabilities: asset detected, open ports, installed software (which may require authenticated scanning), vulnerabilities on the host, other alerts that have happened on the host
- New open port: host that opened a new port
- Software: ew software installed & software version changes
Security teams can search & filter on all alerts over time to get a historic view of the events leading up to the current alert or for forensic research. For example, searches can be made for all events on a specific port or host or across an IP range.
Configuration
To use Qualys CM, you need to schedule Qualys scans of the systems you want to monitor, since that is how you collect the data that is monitored for changes. Normally this is done as part of your company’s vulnerability management or policy compliance program.
Once your scans are configured and you have started collecting data, the Qualys CM configuration wizard walks you through three straightforward steps:
- Monitoring profiles: this defines where (i.e. which systems) you want to monitor. You can identify systems to monitor via asset tagging (Qualys Asset Management) or by IP or by IP range.
- Rulesets: this defines what (i.e. which events) you want to monitor. For example, you can define rulesets to only monitor for new ports on non-Windows systems; or only hosts with specific software; or only alerts based on high CVSS scores. These rulesets can be defined at a granular level to ensure you get alerts only for the events you need to know about.
- Notifications: this defines who (i.e. which individuals or teams) receive alerts. All alerts display on the Alerts Dashboard, but you can define subsets of alerts that go via email to specific individuals or distribution groups. For maximum flexibility, you can define different distribution groups for different sets of alerts, and you can configure individual alerts or digests summarizing alerts over different timeframes.
Resources
For more information, please visit: