A Deep Dive into VMDR 2.0 with Qualys TruRisk™

Table of Contents
- Qualys TruRiskTM Weighs Multiple Risk Factors
- About Qualys Detection Score (QDS)
- Powered by a Comprehensive Exploit & Threat Intelligence Database
- About TruRisk Score
- TruRisk Score Formula
- How Qualys TruRisk Visualizes Risk for an Organization
- How to Prioritize Remediation using Qualys TruRisk scores
- Qualys VMDR Reporting Now Includes TruRisk
- Qualys TruRisk API Support
- Qualys TruRisk Frequently Asset Questions (FAQs)
- Whats Next?
The old way of ranking vulnerabilities doesn’t work anymore. Instead, enterprise security teams need to rate the true risks to their business. In this blog, we examine each of the risk scores delivered by Qualys TruRisk, the criteria used to compute them, and how they can be used to prioritize remediation.
Cybersecurity and IT teams are overwhelmed with the sheer number of vulnerabilities that are disclosed daily.
More than 40% of the vulnerabilities that are reported are either high or critical in severity. IT teams also have limited resources to patch vulnerabilities so, they cannot patch MSeverything. As a result, they need to focus on the right set of vulnerabilities that reduce the maximum amount of risk.
Assessing the risk for a given vulnerability or misconfiguration is easier said than done. Most enterprises prioritize vulnerabilities today based on the Common Vulnerability Scoring System (CVSS) rating system. Yet a CVSS rating represents the technical severity of a vulnerability, not the risk it poses to any given organization. This is an inefficient model because organizations end up patching vulnerabilities that may not reduce risk for their specific and unique business.
For example, CVSS rates the vulnerability CVE-2020-13112 (concerning Amazon Linux Security Advisory for libexif: AL2012-2020-320) at a score of 9.1. This CVE has no known exploits available, and yet is considered a “critical” vulnerability based on severity.
On the other hand, CVE-2021-36942 (the Windows LSA Spoofing Vulnerability) is rated at 5.3 by the National Vulnerability Database (NVD) , yet it’s actively exploited today by malware groups and threat actors. The exploit code maturity is weaponized, making it easy for attackers to exploit the vulnerability to compromise and infect systems (see Figure 1).
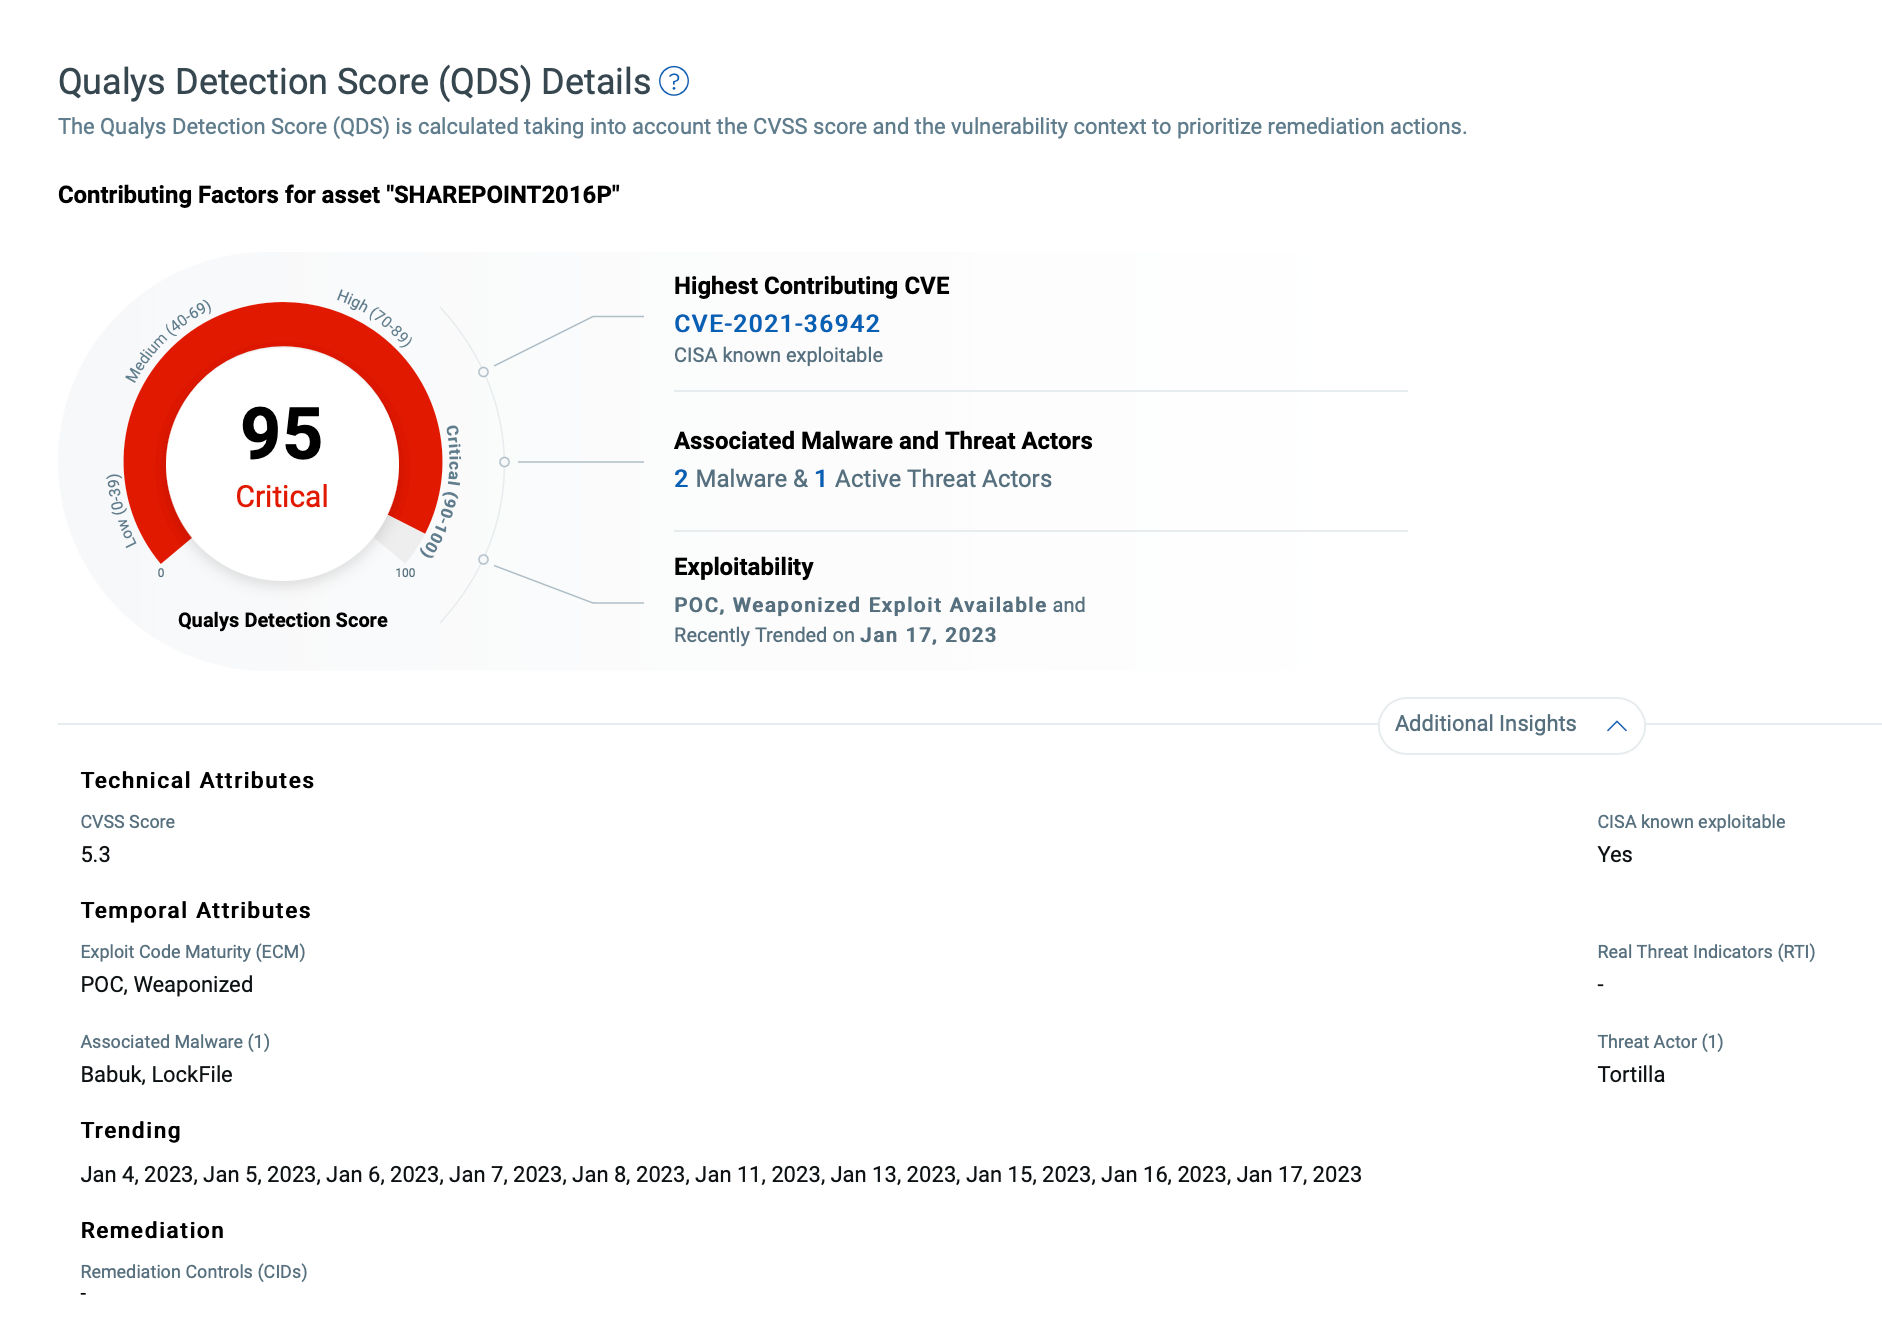
From a cyber risk perspective, CVE-2021-36942 is a far greater risk to an organization than CVE-2020-13112 and should be patched sooner. But due to the lack of threat and risk context available in CVSS based ratings, many organizations would prioritize and remediate CVE-2020-13112 first, even though this won’t reduce much risk to the organization.
Qualys TruRiskTM Weighs Multiple Risk Factors
Qualys has introduced a new approach to prioritize vulnerabilities, assets, and groups of assets based on the actual risk, or “true risk”, they pose to the organization. This allows the average enterprise to focus on 40% fewer critical vulnerabilities, assets, or groups of assets for priority remediation, resulting in maximum risk reduction to the business.
Patent Pending: QLY-019: 17/844,566 QLY-020: 17/844,603
Read the VMDR 2.0 Press Release
Our new offering, Qualys TruRiskTM, also helps organizations quantify cyber risk so that they can accurately measure it, take steps to reduce exposure, track risk reduction trends over time, and better measure effectiveness of their cyber security program.
How? Qualys TruRisk compiles two key risk-based scores in Qualys VMDR 2.0 that are made available to all services of the Qualys Cloud Platform:
- Qualys Detection Score
- TruRisk Score
Let’s examine the formulas behind each of these scores more closely…
About Qualys Detection Score (QDS)
Qualys Detection Score is our new proprietary risk scoring algorithm that measures the true risk of the vulnerability to the customer’s specific, unique IT environment by considering seven different criteria. It returns a holistic risk assessment rather than relying solely on the technical severity of the vulnerability as assessed by the CVSS rating system. This more fine-grained approach allows Cybersecurity teams to focus only on vulnerabilities critical to their business.
Here are the criteria used as input to the algorithm (Fig. 2).
CVSS Base Score
The QDS algorithm starts with the CVSS score as only one of the many inputs to assess the risk of the vulnerability.
Real-Time Threat Indicators (RTIs)
The algorithm next considers the type of vulnerability. For example, is it a Denial-of-Service (DoS) vulnerability or a remotely exploitable vulnerability? In the case of remote vulnerability or a web application vulnerability, the risk is rated higher.
Exploit Code Maturity
The algorithm then analyzes the exploit code maturity for the given vulnerability. The exploit code maturity could be a Proof-Of-Concept (POC) which suggests a theoretical exploit exists. It may already work against systems, or it could be weaponized, in which case the exploit code is considered very mature and can be easily used to compromise a system. The algorithm rates weaponized exploits higher than POC exploits.
Malware
Next, QDS verifies if the vulnerability is actively exploited by malware. If it is actively exploited by any malware, then the risk is rated higher.
Threat Actors
QDS validates if any threat actors or ransomware groups are actively exploiting the vulnerability. If that’s the case, the risk is rated even higher.
Trending Risk
The algorithm also checks if the vulnerability has been actively exploited in the last 14 days by monitoring the Dark Web, social media, GitHub accounts, and many other such sources. The risk is further increased if the vulnerability is determined to be trending and exploited in the wild.
Powered by a Comprehensive Exploit & Threat Intelligence Database
The above-listed factors are assessed by analyzing more than 185,000 CVEs tracked from 25+ different exploit and threat intelligence sources such as Canvas, Metasploit, Exploit DB, and many more. Qualys also tracks GitHub, which is increasingly becoming the favored domain for published exploits once a new vulnerability is disclosed.
Building an accurate risk profile for any CVE requires combining multiple factors to assess its risk. Qualys Detection Score leverages these factors to compute the true risk of the vulnerability.
About TruRisk Score
Qualys TruRisk’s next type of risk score allows organizations to identify the riskiest assets in their organization. To assess the risk an asset poses to an organization, the TruRisk Score considers multiple factors.
The primary measure that’s considered is what we call Asset Criticality. To assess the risk an asset poses to the organization is to determine the business value of that asset. For example: Is the asset part of a production system, or a system hosting a production database, or is it purely an internal system used for development and test purposes. Clearly, production assets should be rated higher.
Qualys TruRisk determines the business criticality of the asset using multiple approaches, including:
- Manual Ratings – TruRisk allows users to set the criticality of the system by using asset tags
- Synchronization with CMDB – Most enterprises store business criticality information for assets in a configuration management database. Qualys automatically maps to CMDB data to match the criticality of the system.
- API’s – Using Qualys APIs for Asset Management and Tagging, users can assign business criticality to an asset, which helps automate the process
- Vulnerabilities found of the system – Finally, TruRisk analyzes the vulnerabilities found on the system and determines the asset’s risk based on the QDS scores. Vulnerabilities with higher QDS scores on the asset result in a higher TruRisk Score.
TruRisk Score Formula
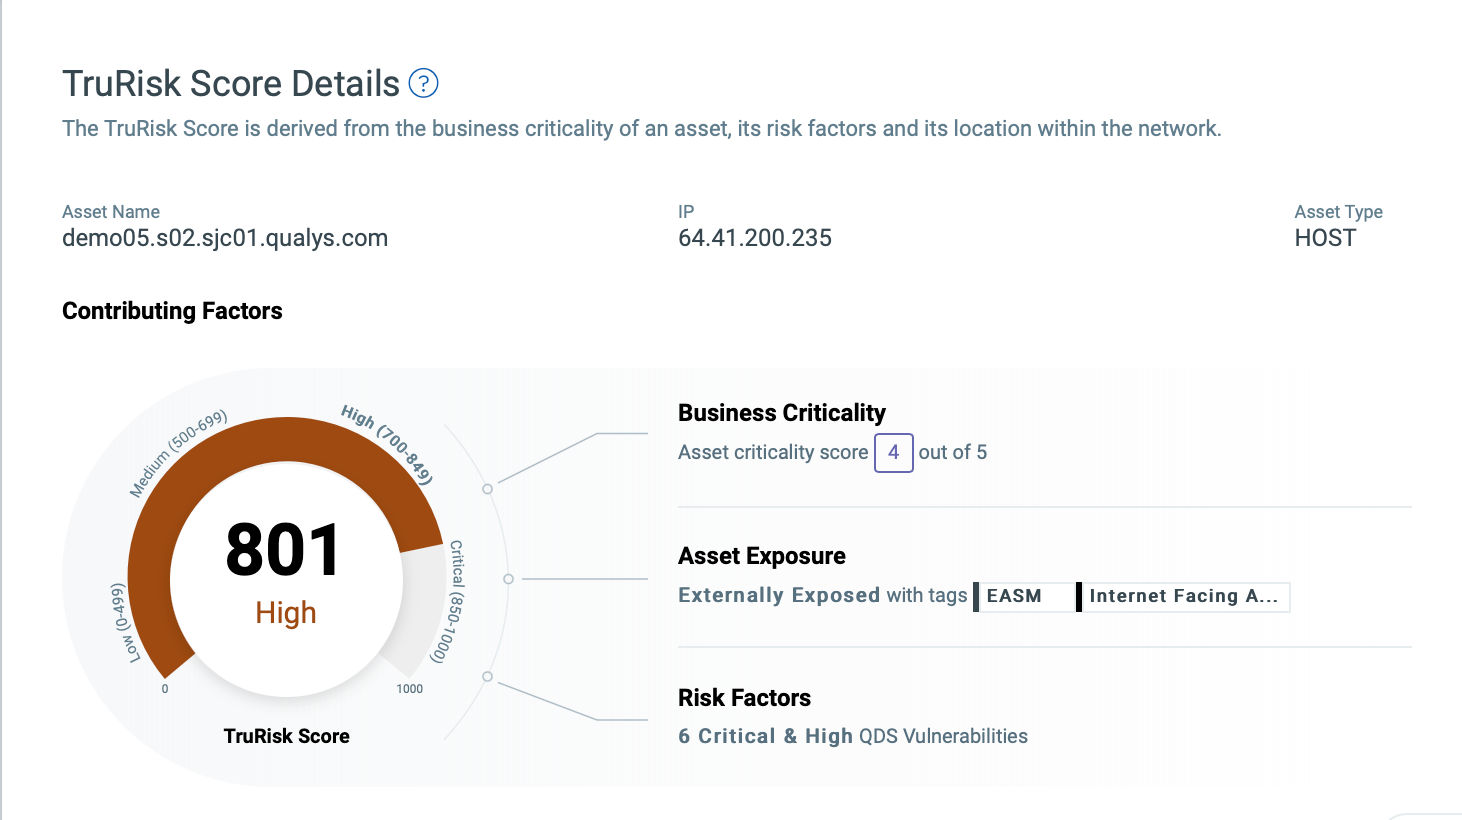
Based on the above criteria Qualys assigns a TruRisk Score to the asset.
As shown in Figure 3, the TruRisk is computed based on the above criteria to the following formula:
TruRisk Score = Asset Criticality Score * {Weighted.average of vulnerabilities}
Weighted.average of vulnerabilities = wc(Avg(QDSc)) + wh(Avg(QDSh)) + wm(Avg(QDSm)) + wl(Avg(QDSl))
How Qualys TruRisk Visualizes Risk for an Organization
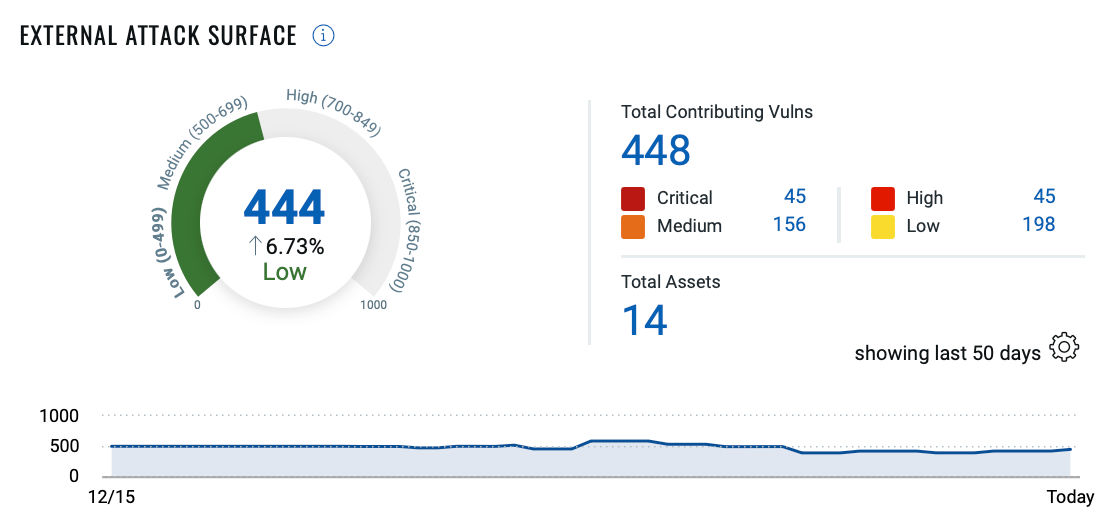
The new Risk Score widget introduced in VMDR 2.0 with Qualys TruRisk helps to visualize an overall cyber risk score for an organization, or a risk score for a specific environment or asset groups within the organization.
It helps to visualize how cyber risk is being mitigated and will show the reduced score if the vulnerabilities on the group of assets are fixed. The trending details help to visualize risk reduction in a better way. Risk score widgets show how different teams across the organization are performing and how they are maintaining cyber risk to the business under an acceptable limit.
This Risk Score is an average of all the TruRisk scores within the tag selected. If there is no tag selection, then the average for all the assets within the environment is calculated to show overall cyber risk for the organization (Fig. 4).
How to Prioritize Remediation using Qualys TruRisk scores
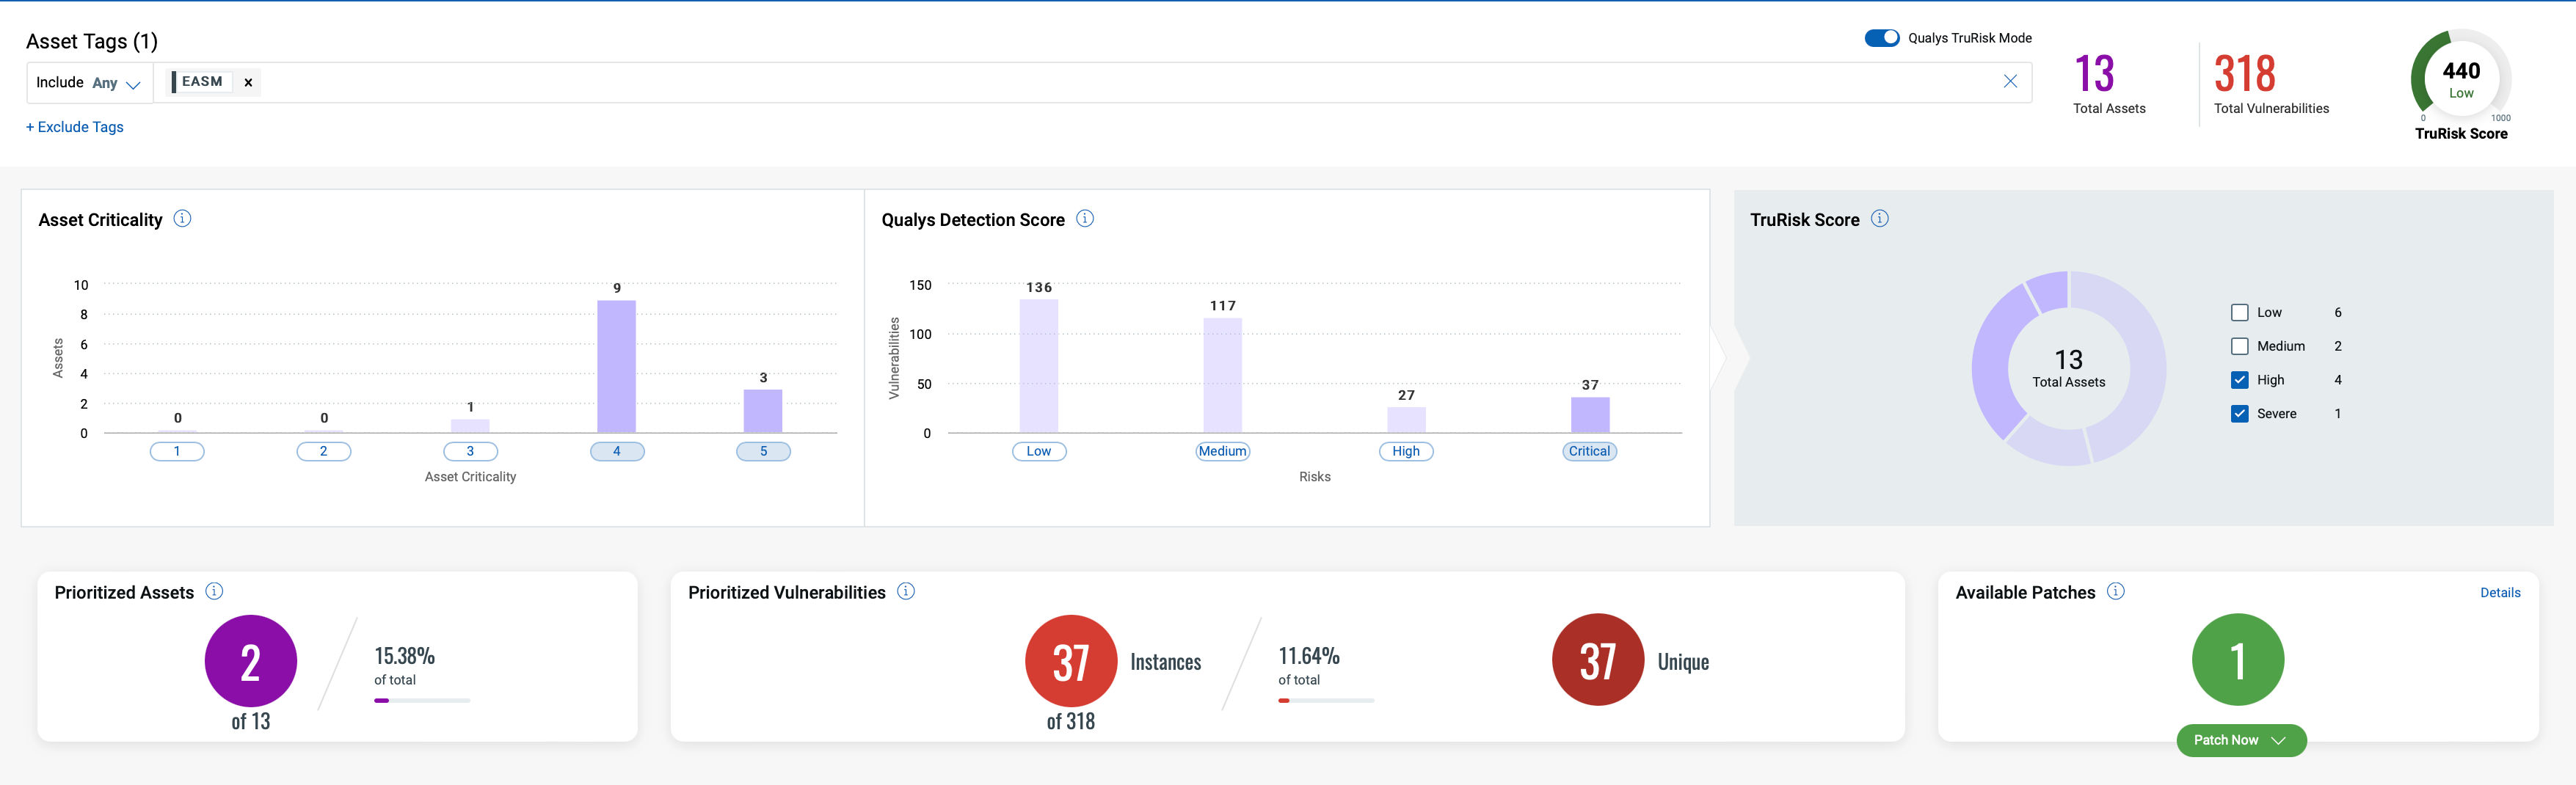
VMDR 2.0 with Qualys TruRisk has introduced several new filters which help to prioritize vulnerability remediation based on risk scores. The new feature “Qualys TruRisk Mode” under the prioritization menu tab offers three main filters on TruRisk:
- Filter by Asset criticality – Allows users to select asset criticality ranging from 1 to 5
- Filter by Qualys Detection score – Allows users to filter vulnerabilities for the assets within the selected tag by QDS scores
- Filter by TruRisk score – Allows users to filter number of assets based on their risk score and helps focus on riskiest assets during prioritization
Using these filters (Fig. 5), users can focus on the riskiest assets and their critical vulnerabilities easily without needing to understand complex criteria like different kinds of RTIs and other parameters associated with vulnerabilities.
Qualys VMDR Reporting Now Includes TruRisk
The enhanced reports in VMDR 2.0 now include all TruRisk details. Risk score columns are now included toward the end of the host-based scan reports.
Reports include QDS, ACS, and TruRisk values.
Portal vulnerability reports are another way offered in VMDR 2.0 that helps users to export Risk Score details.
Qualys TruRisk API Support
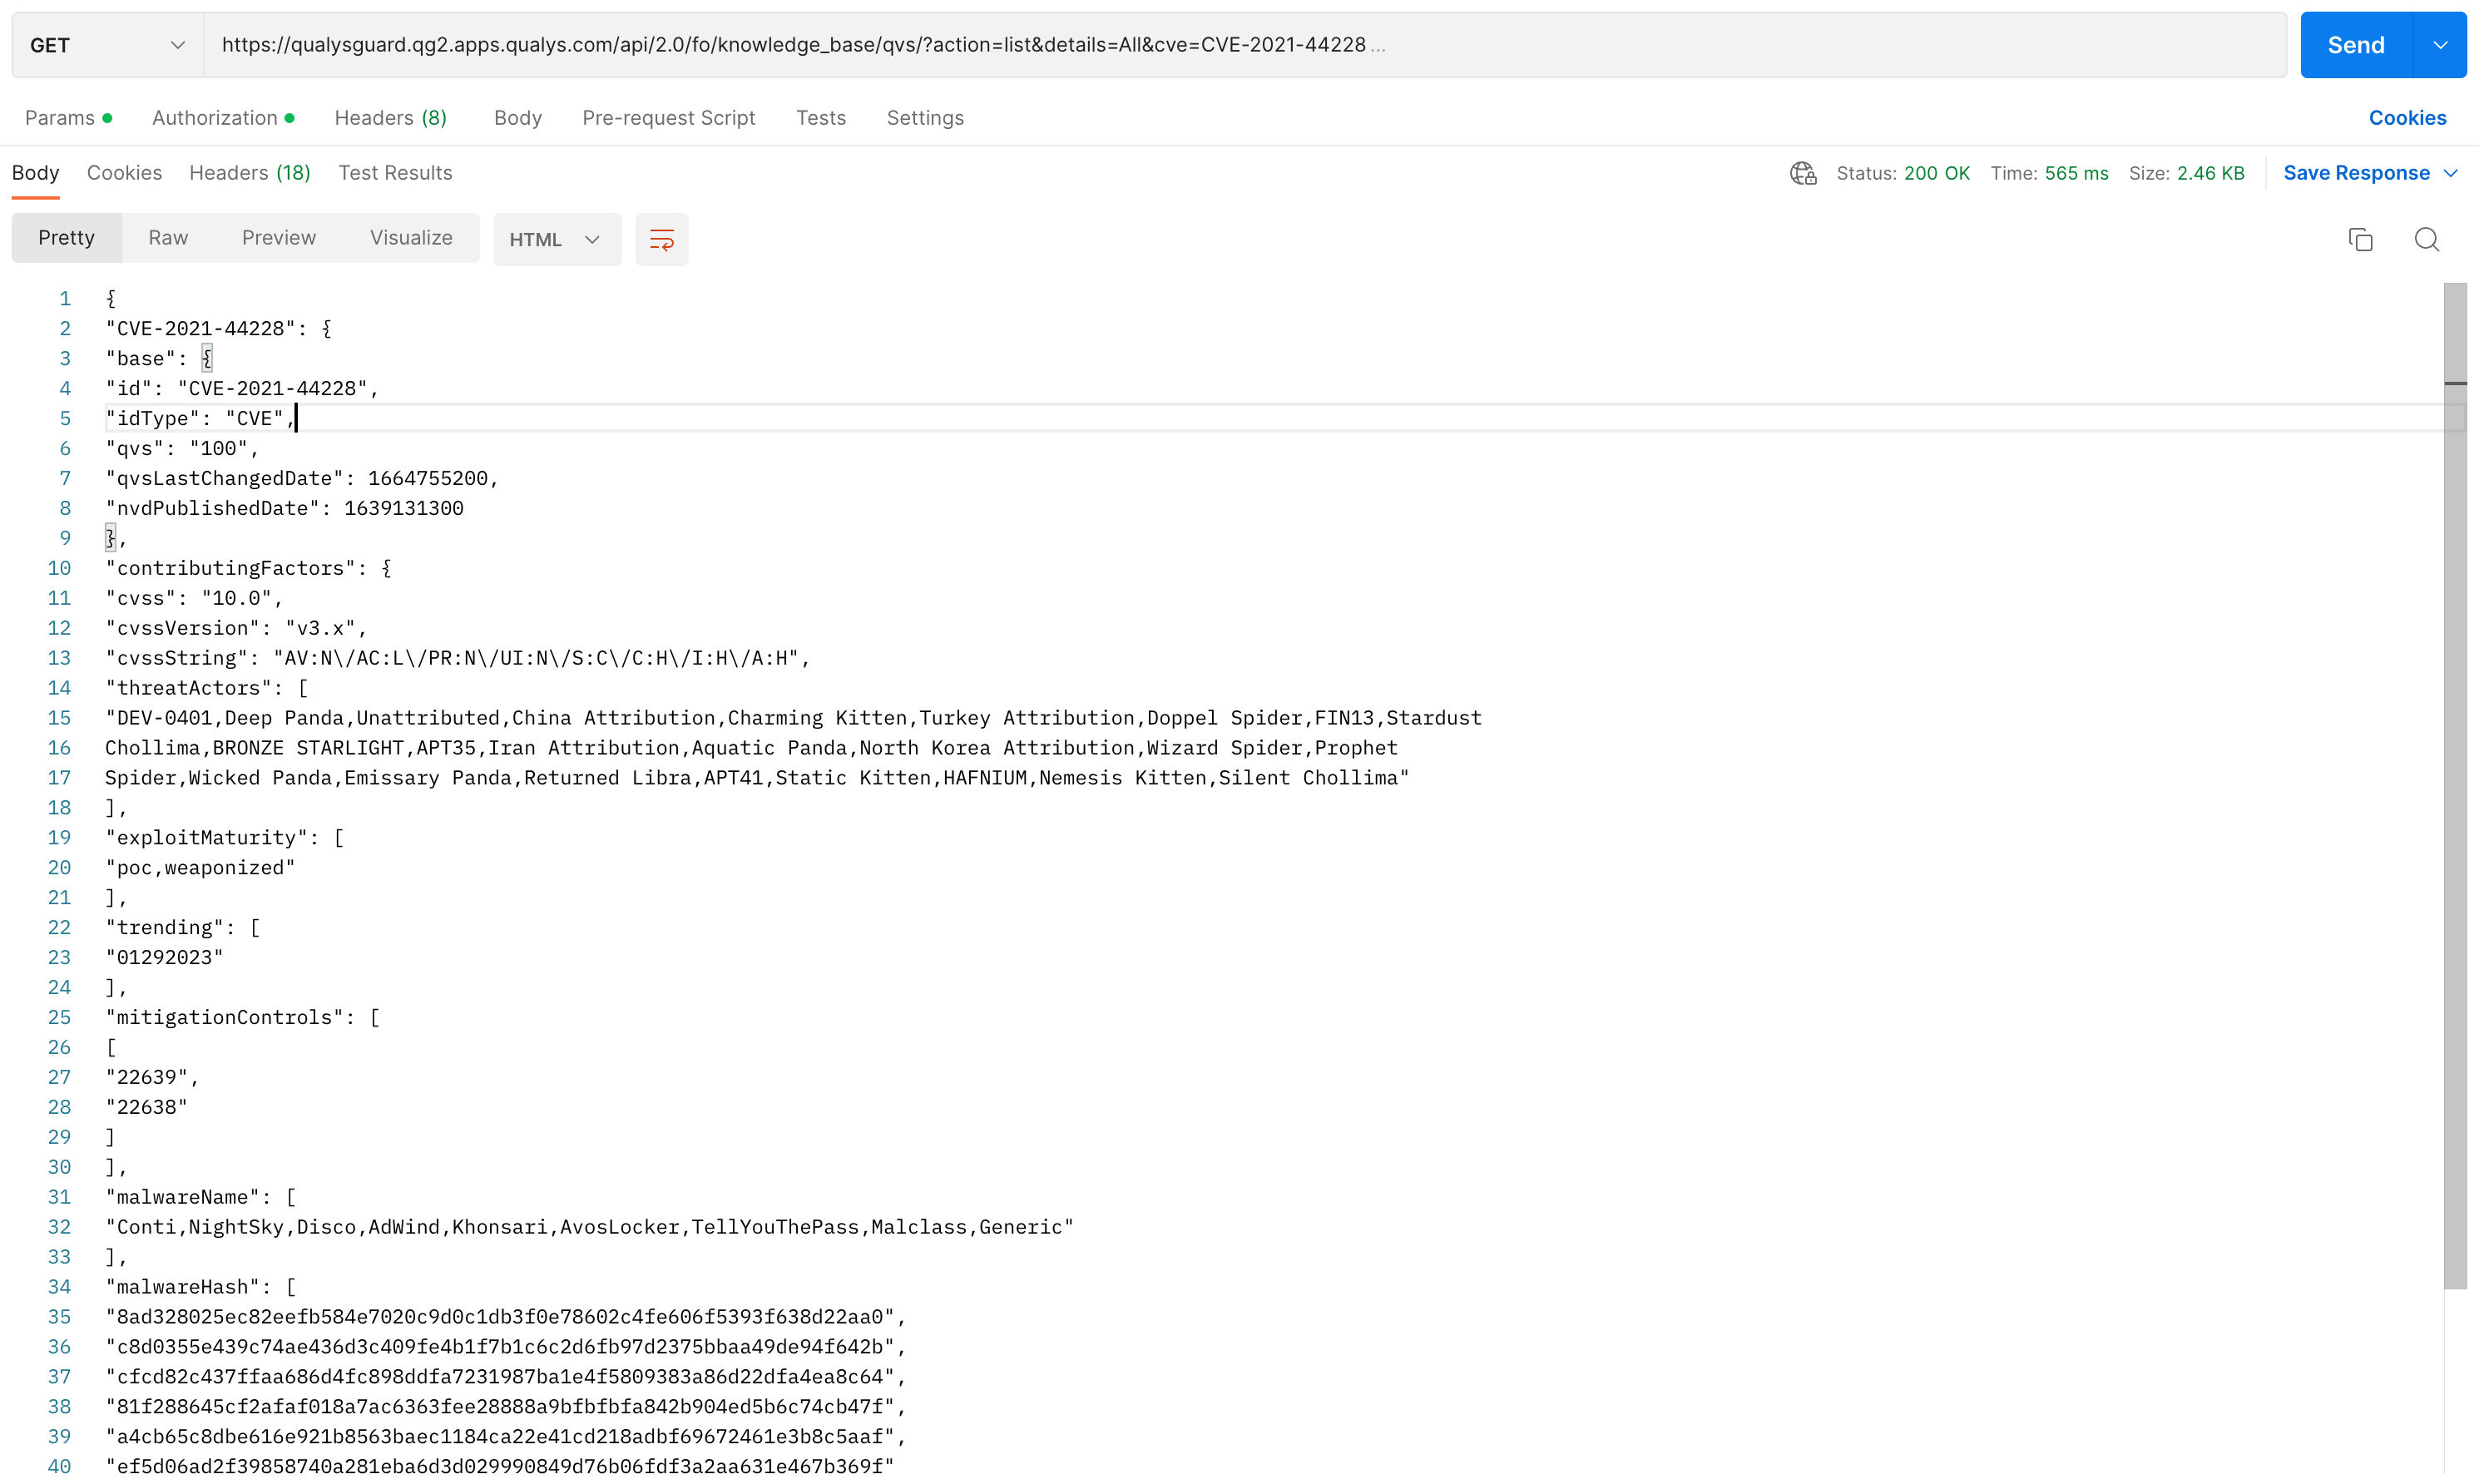
A new API has been introduced as part of the release of Qualys VMDR 2.0. This API is CVE centric and helps users get details about each CVE and its corresponding Qualys Vulnerability Score (QVS). Even if the CVE doesn’t have any associated QIDs, the API helps users retrieve the QVS score and contributing factors to the score
Users can search the Qualys knowledgebase for information on a CVE using this API Endpoint string: https://<POD name>/api/2.0/fo/knowledge_base/qvs/?action=list&details=All&cve=<CVE ID>
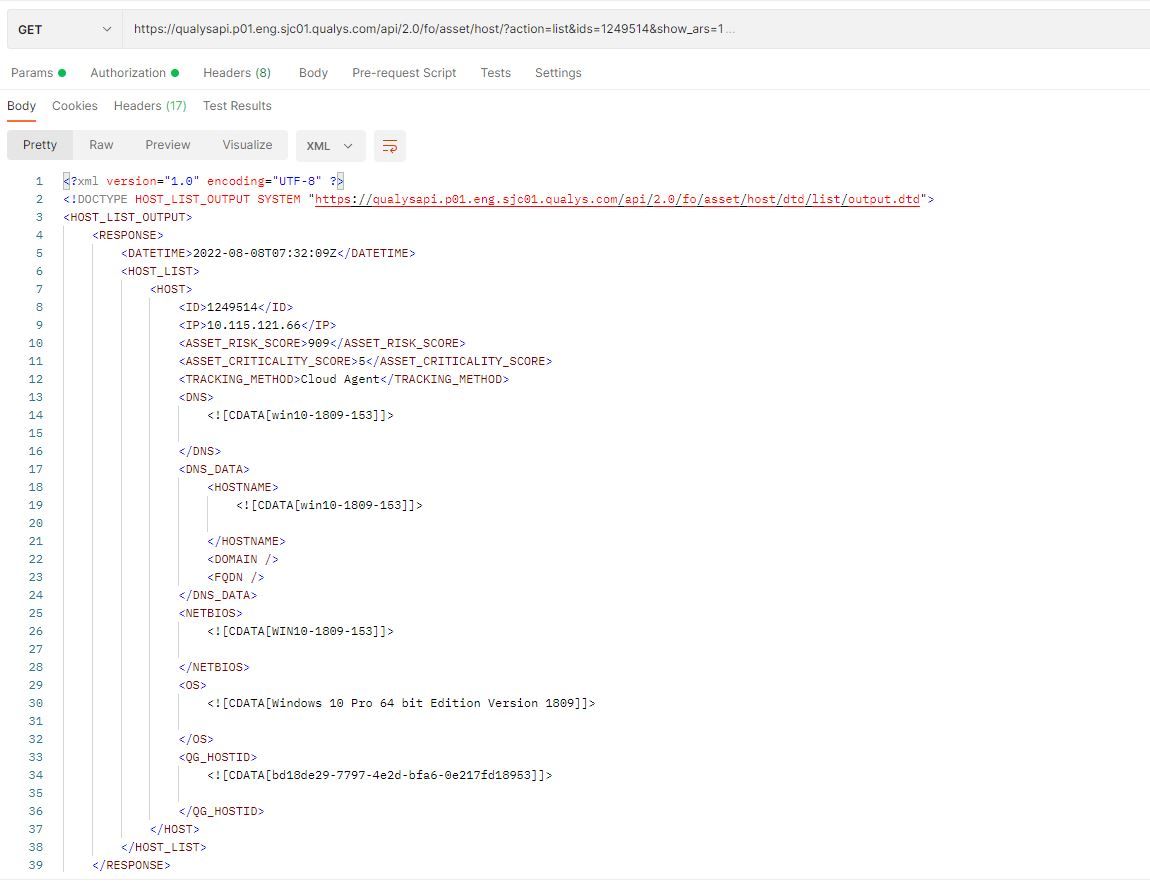
We have also modified our existing APIs for Hosts. Host list and Host list detection have been modified to give users the option of exporting the details of TruRisk scores.
For the Host list API, the new parameter introduced is: - show_ars=1. When this optional parameter is added, ARS detail will appear in the output XML (Fig. 6).
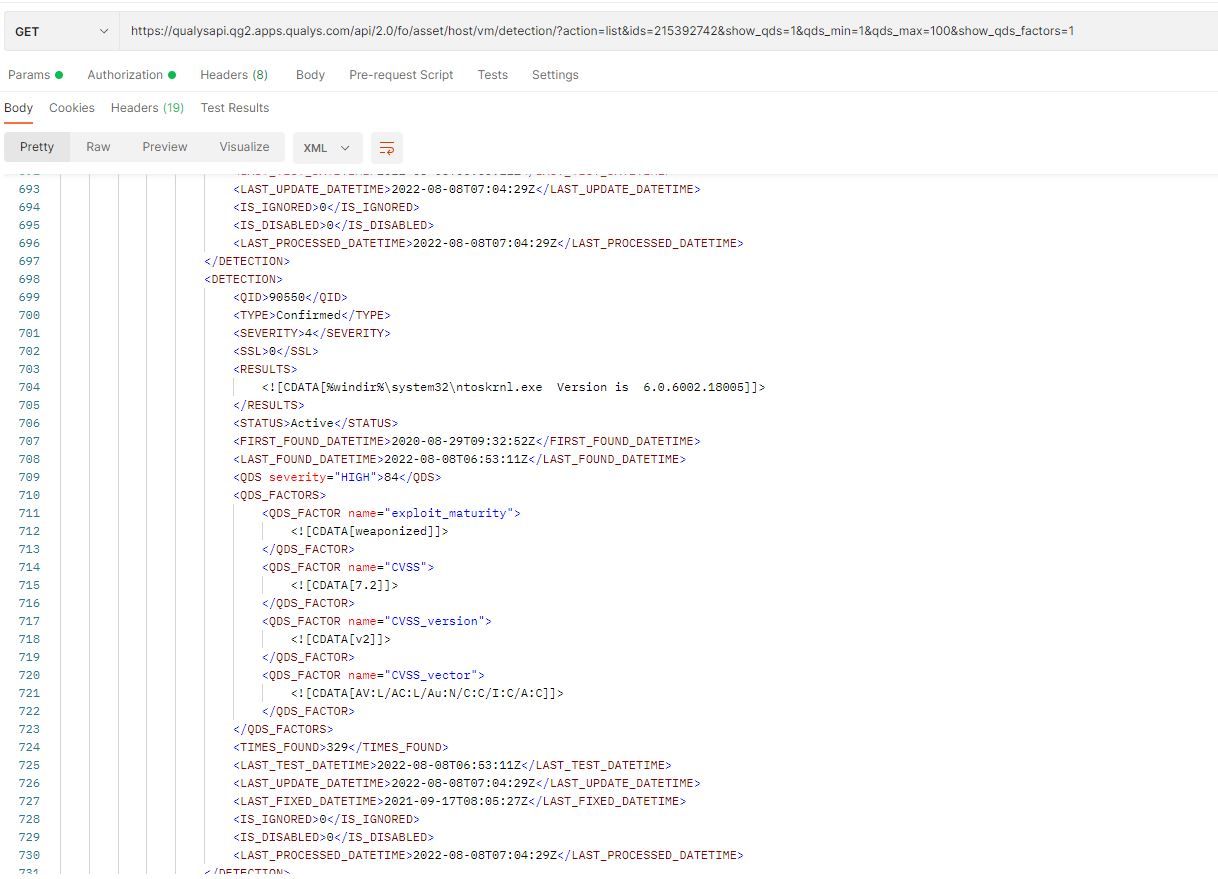
For Host list detection, the new parameters introduced are: show_qds=1, qds_min=1, qds_max=100, and show_qds_factors=1. These parameters help to retrieve the QDS and its contributing factors as part of the output XML (Fig. 7).
Free Trial
Qualys VMDR: Get Started with a 30-day Free Trial
Qualys TruRisk Frequently Asset Questions (FAQs)
How are QDS scores calculated for each vulnerability?
The scores are updated during the asset scan. When the vulnerabilities are detected, we determine which CVE contributes the most. The CVE with the highest QVS score is selected.
Why is the QDS score blank for some Qualys IDs?
If the QID is associated to a latest CVE for which the National Vulnerability Database doesn’t hold any details, then for such vulnerabilities the QDS score is blank.
If there are multiple tags on an asset that represent different criticality, which tag is used in the TruRisk Score formula?
The tag that has the highest criticality value is chosen for TruRisk Score formula.
Why are some vulnerabilities scored higher by QDS compared to the CVSS score?
When the QDS score is calculated, the formula looks at the details of each criterion mentioned in the QDS section above. If the formula determines that the CVE has active threats and falls under an exploitable category, it will result in a higher QDS score as compared with its CVSS score, which is a static score assigned at the time when the vulnerability is first disclosed and filed.
What’s Next?
As we look out into the future, we see a clear need for organizations to get a unified view of risk across the organization, not just from solutions such as Qualys VMDR, but from other third-party vulnerability management and cybersecurity solutions people may have already invested in different parts of the organization. Qualys will invest in bringing in disparate data sets into a single unified solution to provide a unified view of risk. Stay tuned.
Are you Proactive with this brilliant idea? For example would it have picked uo the recent cyber attack on the UK NHS ambulane phones? Full details are here: https://metro.co.uk/2022/08/06/nhs-111-service-hit-by-hostile-cyber-attack-17137661/?ico=tag-post-strip_item_3_news