In-Depth Look Into Data-Driven Science Behind Qualys TruRisk

Table of Contents
- Key Takeaways
- Vulnerabilities Are on the Rise
- Vulnerability Threat Landscape
- Challenges With CVSS Based Prioritization
- Exploit Prediction Scoring System
- Qualys Severity Levels
- Qualys TruRisk, a Data-Driven Way To Prioritize Risks
- CVSS Base Score
- CISA Known Exploited Vulnerability (KEV)
- Real-Time Threat Indicators (RTIs)
- Exploit Code Maturity
- Malware
- Threat Actors / Ransomware Groups
- Trending Risk
- Applied Mitigation Controls
- EPSS Score (from First.org)
- How Does Qualys TruRisk Compare Against CVSS and EPSS?
- Qualys Vulnerability Score (QVS) vs CVSS
- Qualys TruRisk vs EPSS
- Qualys TruRisk (QVS) vs CISA KEV
- How to Interpret Qualys TruRisk Scores
- Asset Risk Score (ARS)
- Asset Risk Score Formula
- Conclusion
- Additional Contributors
Vulnerability Management is a foundational component of any cybersecurity program for the implementation of appropriate security controls and the management of cyber risk. Earlier this year Qualys introduced the latest iteration of its vulnerability management product VMDR 2.0 with TruRisk which focusses on helping organizations understand and manage cyber risk. Qualys TruRisk assesses risk by taking into account multiple factors such as evidence of vulnerability exploitation, asset criticality, its location, and evidence of compensating controls on the asset among many other factors to assess the accurate risk posture for an organization.
In this blog we do a deep-dive into the vulnerability prioritization algorithm for TruRisk, compare it to existing vulnerability scoring systems, such as Common Vulnerability Scoring System (CVSS) and Exploit Prediction Scoring System (EPSS), to demonstrate why TruRisk is a better method for prioritizing risk than existing methods. This blog is the first of many blogs focused on different aspects of TruRisk, with other aspects covered in later blogs.
Key Takeaways
- Since 2016, every subsequent year has reported more vulnerabilities than the year before (on average 8%-10% more)
- CVSS based prioritization results in 51% of vulnerabilities marked as high or critical which leads to ineffective, low-value prioritization
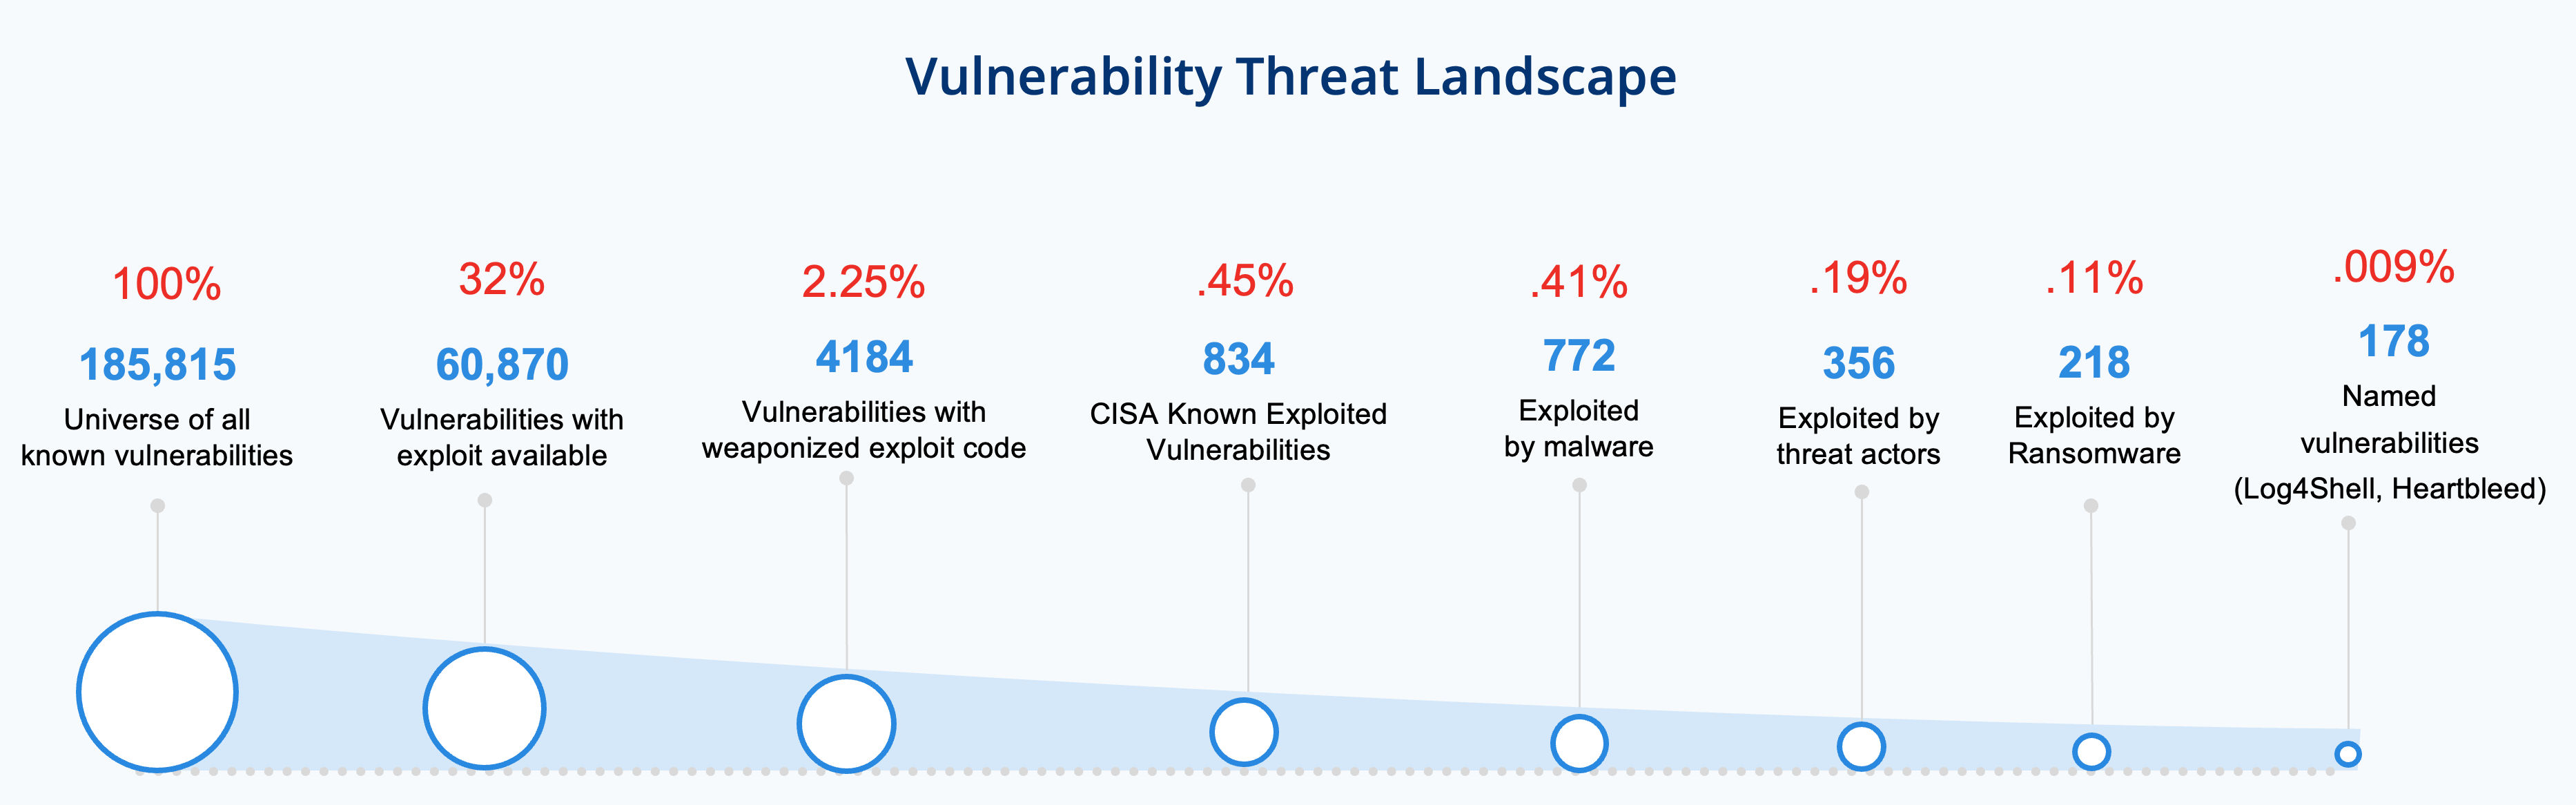
- Less than 3% of vulnerabilities have weaponized exploits or evidence of exploitation in the wild, two attributes posing the highest risk.
- Exploit Prediction Scoring System (EPSS) is a step in the right direction to predict vulnerability exploitation. However, it still ranks some vulnerabilities that are actively exploited with a lower probability of exploitation
- Qualys TruRisk helps organizations prioritize risk by focusing on exploitability, evidence of exploitability, and likelihood of exploitability resulting in up to 85% fewer vulnerabilities to prioritize compared to CVSS.
Qualys TruRisk brings asset context, threat context and vulnerability intelligence data under one platform empowering IT and security teams to make better, informed prioritization decisions.
But first let’s talk about few key challenges.
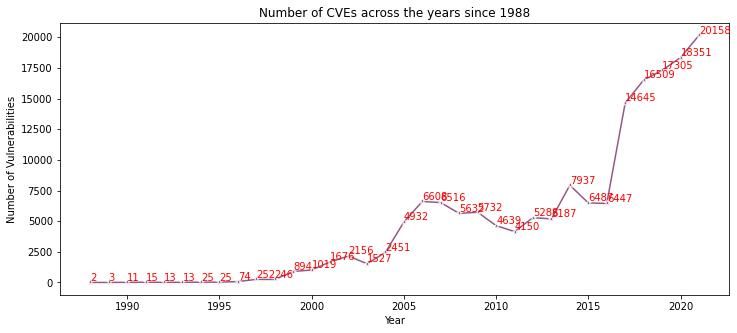
Vulnerabilities Are on the Rise
Every year since 2016, (see Fig. 1) the number of the vulnerabilities reported by NIST has been greater than the year before. According to the National Vulnerability Database (NVD) the number of vulnerabilities reported in 2022 (18,841) has already surpassed the vulnerabilities reported in 2020. And we still have three months to go.
Vulnerability Threat Landscape
As the number of vulnerabilities increase, so does the risk to enterprises. But not all vulnerabilities are created equally. Some vulnerabilities pose greater risk to organizations than others. For example, less than 3% of the vulnerabilities have exploit code weaponized. It is crucial to prioritize vulns like these, that are some of the most critical vulnerabilities first.
Traditionally, organizations have relied on CVSS scores for prioritization. However, as we will see in the next section, there are limitations in using CVSS as the only vulnerability prioritization method.
Challenges With CVSS Based Prioritization
The Common Vulnerability Scoring System (CVSS) was introduced in the early 2000s to address the need for a common method to rate the severity of vulnerabilities. Previously, two researchers could rate the same exact vulnerability in different ways based on their subjective understanding of the vulnerability. This created confusion for security practitioners because they could not accurately determine the actual severity of vulnerabilities. The CVSS system was developed to address this issue by enabling the uniform technical severity assessment of vulnerabilities.
A key factor to keep in mind is CVSS only calculates the technical severity of the vulnerability, not the risk it poses to an organization. Over time, CVSS has been used as a proxy for determining the risk a vulnerability posed to the organization, leading to unintended consequences. This includes patching cycles spent fixing countless vulnerabilities with a CVSS score of 7.5 or higher, while some medium severity vulnerabilities were deprioritized even if they posed a greater risk.
CVSS scores are categorized into four categories low, medium, high, critical.
| CVSS Score | CVSS Severity |
|---|---|
| 0.1 – 3.9 | Low |
| 4.0 – 6.9 | Medium |
| 7.0 – 8.9 | High |
| 9.0 – 10.0 | Critical |
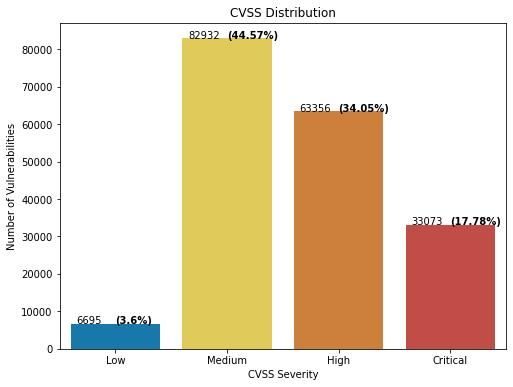
As shown in Fig.3, 51% (96,340) of the total vulnerabilities are categorized as Critical or High according to CVSS scores. However, empirical research shows that not all the vulnerabilities in these CVSS score buckets need equal/high attention. The main issue is that CVSS base scores don’t consider threat information like active exploitation in the wild, likelihood of the exploitation in the wild, activity associated with it in dark web or social media, known exploit categorized by CISA, threat actors associated, etc.
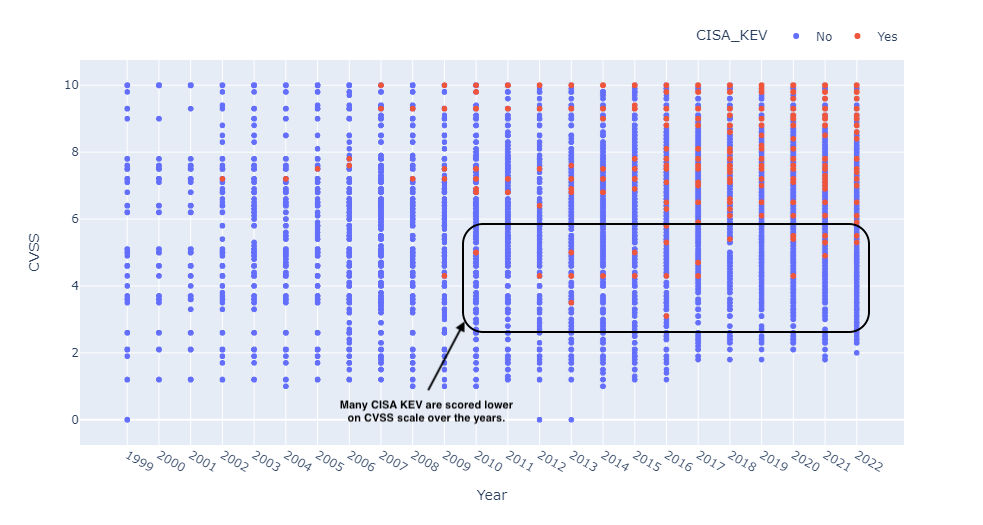
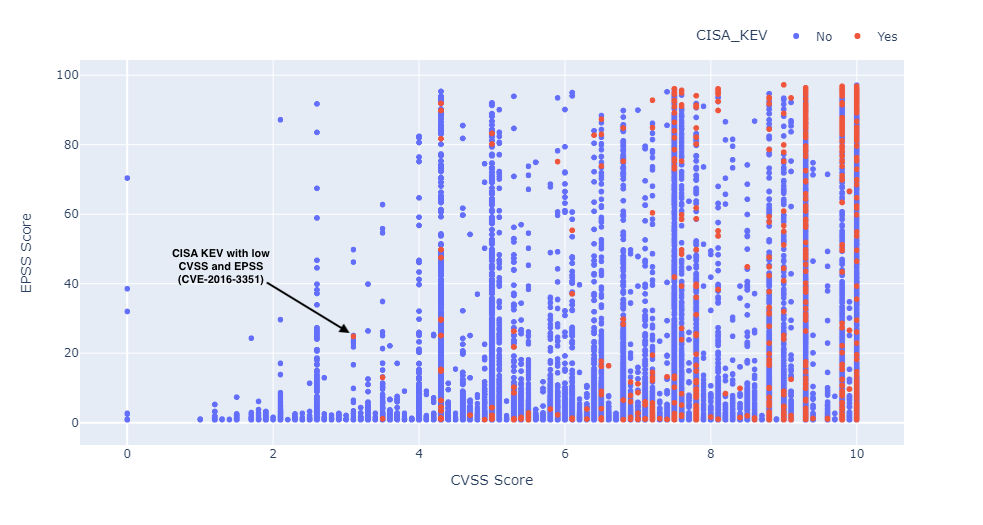
As shown in Fig. 4, as expected known exploited vulnerabilities (as categorized by CISA Known Exploited Vulnerabilities (KEV) Catalog) are concentrated at higher CVSS scores (the red dots indicate CISA KEV vulnerabilities).
However, there are a significant number of exploits discovered even for lower CVSS scores. For example, there are 92 out of 832 (11%) CISA_KEV vulnerabilities that have a CVSS score of less than 7. This could be an issue when relying only on CVSS scores.
Exploit Prediction Scoring System
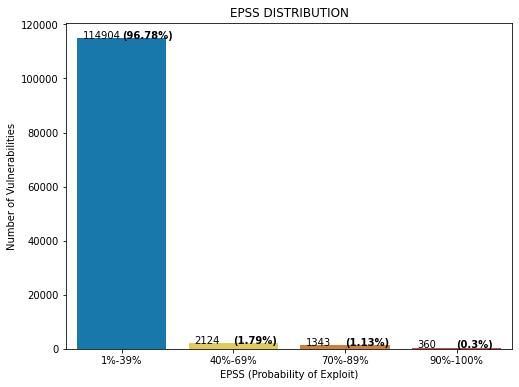
To address challenges related to lack of threat context in the CVSS scoring system, first.org in recent years introduced Exploit Prediction Scoring System (EPSS), an open, data-driven effort for estimating the likelihood (probability) that a software vulnerability will be exploited in the wild. This is a step in the right direction. EPSS’s goal is to help network defenders better prioritize vulnerability remediation efforts. The EPSS model produces a probability score between 0 and 1 (0 and 100%). The higher the score, the greater the probability that a vulnerability will be exploited.
As evidenced by Figure 5. EPSS helps highlight vulnerabilities with high likelihood of exploitation and correlates well with CISA KEV vulnerabilities.
The availability of patches also plays a key role in EPSS scores. If patches are available, the probability of exploitation is ranked lower. Many of the CISA Known Vulnerabilities are scored lower in EPSS if they have patches/fixes available. However when prioritizing what to patch first, we need to consider the whole set, not just the ones with patches. For example, consider the following recent vulnerabilities which have low EPSS scores. If we rely only on EPSS to prioritize them, they will not show up in a priority list of vulnerabilities to be remediated. Several examples of vulnerabilities with low EPSS scores and high TruRisk scores are shown in Figure 5.
| CVE | Title | EPSS | TruRisk (QVS) |
|---|---|---|---|
| CVE-2021-36942 | PetitPotam | 0.26 | 95 |
| CVE-2021-31207 | Proxyshell | 0.02 | 95 |
| CVE-2021-34523 | Proxyshell | 0.16 | 100 |
| CVE-2022-30190 | Follina | 0.69 | 100 |
| CVE-2016-3351 | Microsoft Edge Cumulative Security Update (MS16-105) | 0.24 | 95 |
Qualys Severity Levels
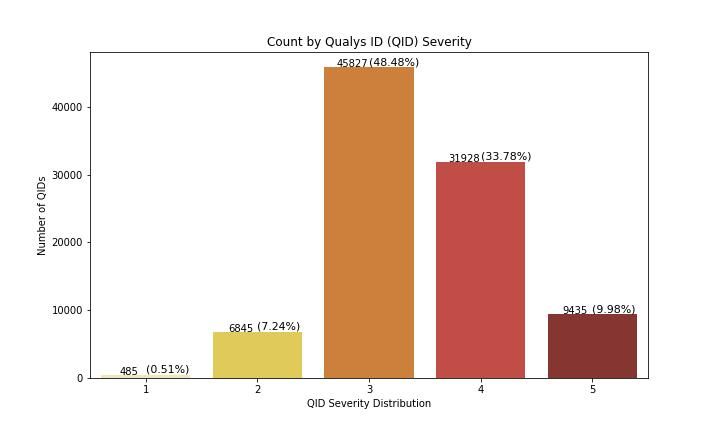
Given the challenges with CVSS scores, the Qualys research team introduced Qualys severity levels to assess the severity of Qualys IDs (QIDs). In addition to determining the risk associated with exploitation, Qualys severity levels also focus on potential consequences of vulnerability exploitation from an attacker’s point of view. Each QID severity level is reviewed by the Qualys Research Team, including taking vulnerability chaining, server-side vs client-side vulnerabilities, and information from various threat-intel sources to accurately assess them into consideration.
Qualys severity levels are an improvement over CVSS as they helped customers quickly prioritize critical vulnerabilities as can be seen in Fig. 7.
Qualys TruRisk, a Data-Driven Way To Prioritize Risks
All of the scoring mechanisms presented so far are attempting to answer one key question
What should defenders focus on first?
Each model attempts to answer the question in its own way but falls short of its goal. Organizations need a better way to respond quickly and prioritize vulnerabilities based on risk.
To address these challenges Qualys introduced Qualys VMDR 2.0 with TruRisk earlier this year to help organizations prioritize vulnerabilities, assets, and groups of assets based on risk.
Qualys VMDR with TruRisk is powered by one of the most comprehensive exploit and threat intelligence databases. It spans over 185k CVEs, and 25+ unique threat and exploit intelligence sources such as Metasploit, Canvas, CISA KEV, and even Github, which is increasingly becoming the go-to place to publish exploits.
With TruRisk, organizations can pinpoint which CVEs are exploited in the wild (even those that don’t have a QID) and which malware, ransomware, or threat actor groups are exploiting them. These insights can then be used to prioritize vulnerabilities based on risk.
Let’s take a closer look into how the TruRisk algorithm works, and how it compares to CVSS and EPSS.
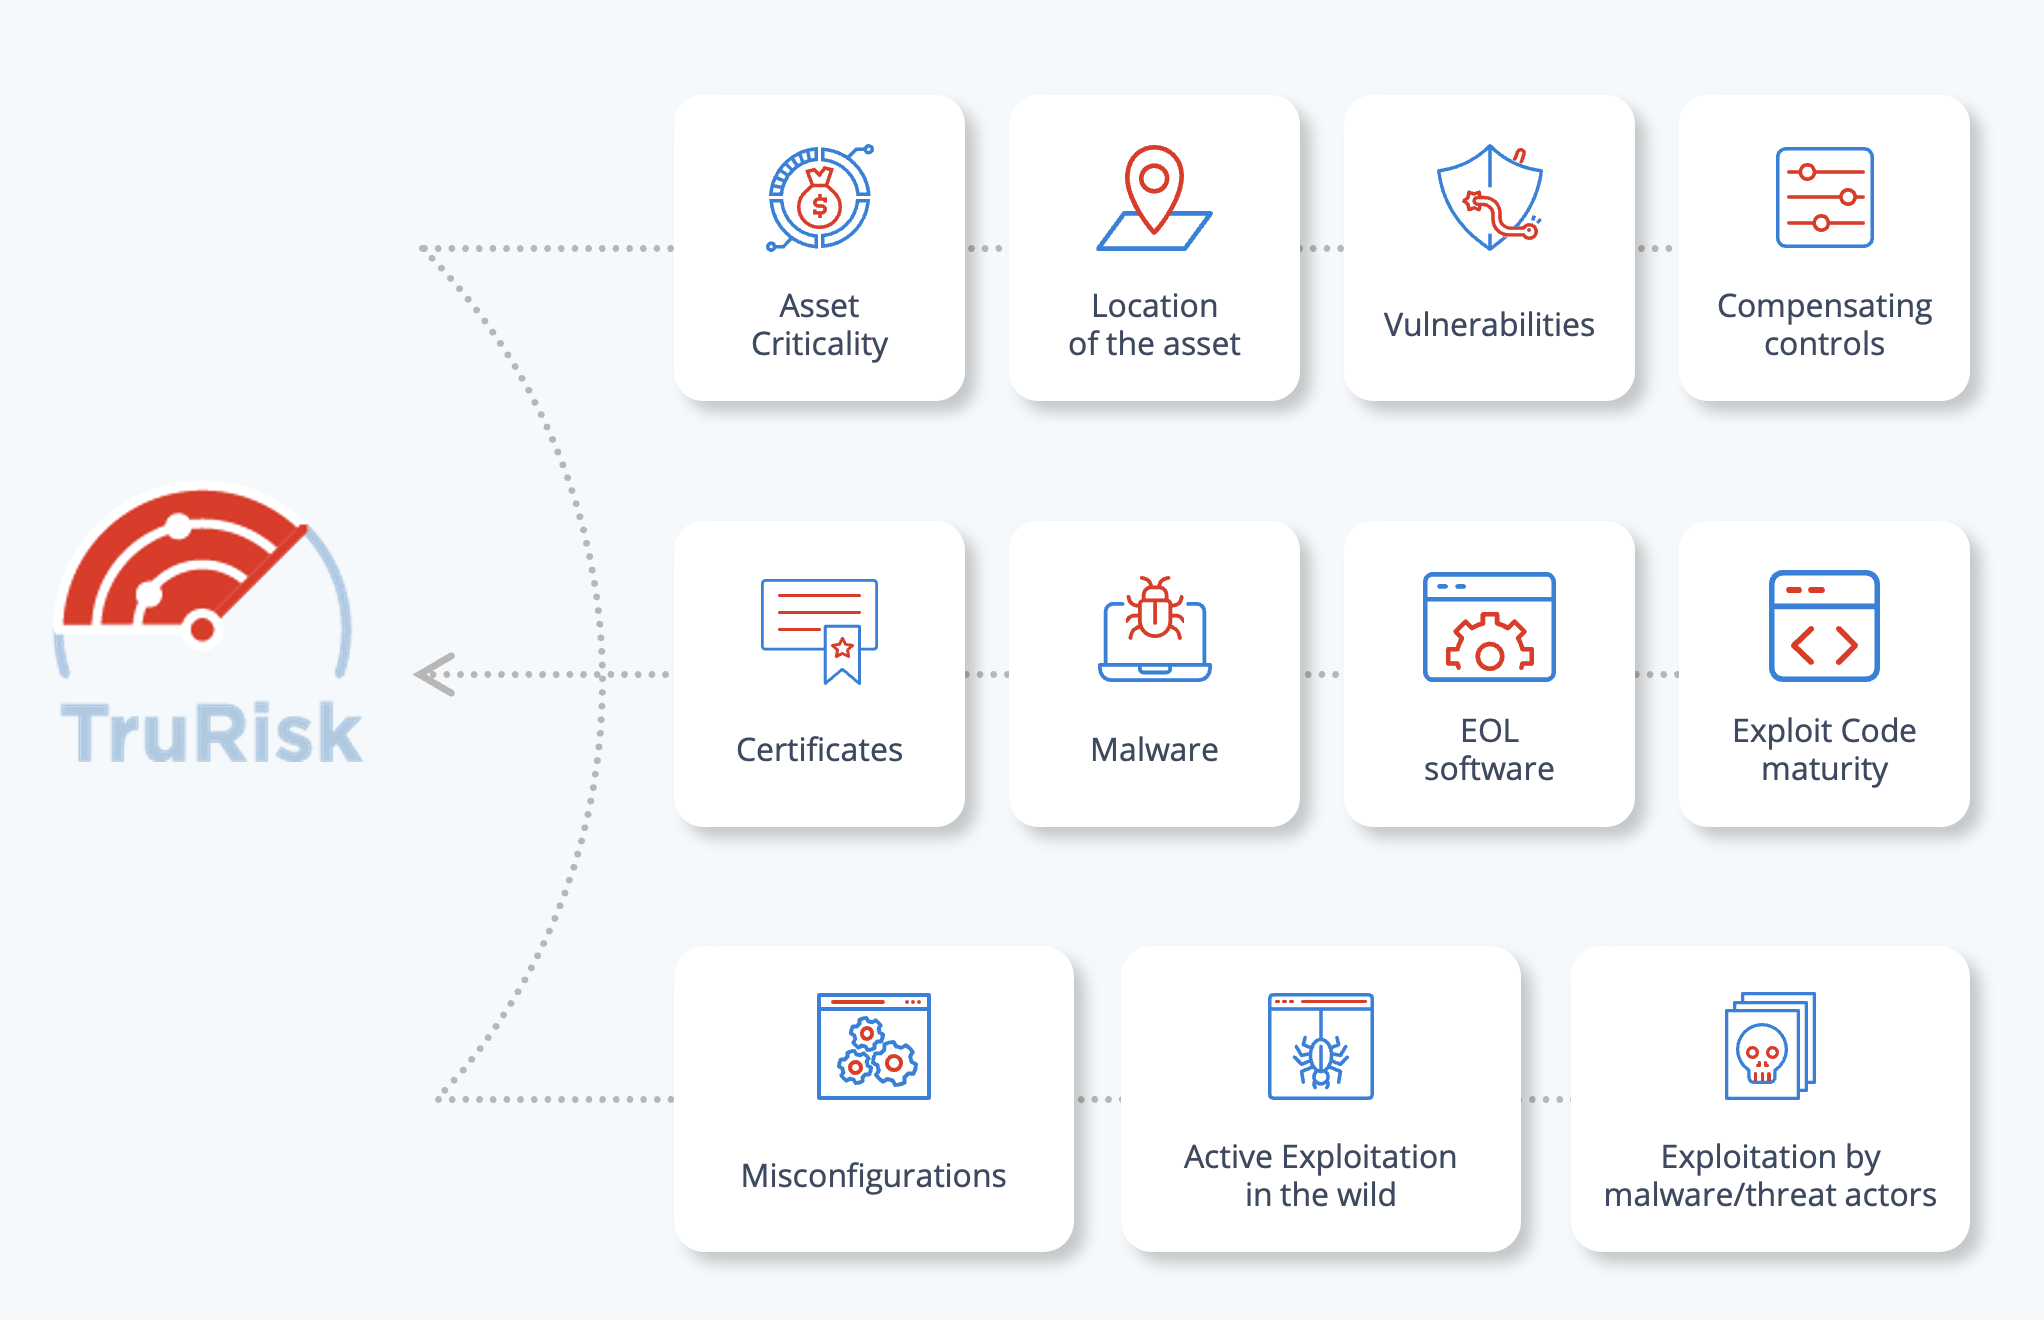
To determine risk, Qualys TruRisk vulnerability scores rely on multiple factors to build the most accurate risk profile for a vulnerability.
Qualys Vulnerability Score (QVS) is a Qualys-assigned score for a vulnerability based on multiple factors associated with the CVE such as CVSS and external threat indicators like active exploitation, likelihood of vulnerability being exploited in wild, sighting in the darkweb and social web, exploit code maturity, CISA known exploitable and many more.
Qualys Detection Score (QDS) is assigned to QIDs by Qualys. QDS has a range from 1 to 100. If multiple CVEs contribute to a QID, the CVE with the highest score is considered for the QDS calculation.
Asset Risk Score (ARS) is the overall risk score assigned to the asset based on the following contributing factors such as Asset Criticality Score (ACS), QDS scores for each QID level, Auto-assigned weighting factor (w) for each criticality level of QIDs, number of vulnerabilities on an asset.
Here is the list of inputs that go into the algorithm.
CVSS Base Score
The CVSS base score serves as one of the key inputs to assess the risk of the vulnerability. CVEs with higher CVSS base scores are rated higher than those with lower scores. But a high CVSS score alone doesn’t result in a high TruRisk risk score. Evidence of exploitation or weaponized exploit code maturity is required for the CVE to fall in the critical range.
CISA Known Exploited Vulnerability (KEV)
Vulnerabilities that are catalogued by CISA as known exploited vulnerabilities that are actively being exploited in the wild are included in the algorithm
Real-Time Threat Indicators (RTIs)
The TruRisk algorithm considers the type of vulnerability. For example, is it a Denial-of-Service (DoS) vulnerability or a remotely exploitable vulnerability? In the case of remote vulnerability or a web application vulnerability, the risk is rated higher. Other RTI’s such as zero-day, active attacks, high data loss, high lateral movement, etc. that are collected from various threat feeds are also considered by the algorithm.
Exploit Code Maturity
The TruRisk algorithm analyzes the exploit code maturity for the given vulnerability. The exploit code maturity could be a Proof-of-Concept (PoC) which suggests a theoretical exploit exists. The exploit may already work against systems, or it could be weaponized, in which case the exploit code is considered very mature and can be easily used to compromise a system. The QDS algorithm rates weaponized exploits higher than PoC exploits.
Malware
The TruRisk algorithm checks to see if the vulnerability is being actively exploited by malware. If it is, then the risk is rated higher.
Threat Actors / Ransomware Groups
The TruRisk algorithm validates if any threat actors or ransomware groups are actively exploiting the vulnerability. If that is the case, the risk is rated even higher than if it only being exploited by malware.
Trending Risk
The TruRisk algorithm checks if the vulnerability has been actively exploited in the last 14 days by monitoring the Dark Web, social media, GitHub accounts, and many other similar sources. The risk is further increased if the vulnerability is determined to be trending and exploited in the wild.
Applied Mitigation Controls
The algorithm correlates the risk from the vulnerability with intelligence related to the asset to assess whether the vulnerability represents a threat to it. For example, the vulnerability may exist on the asset, but the system may have mitigation controls already applied which greatly reduce the risk of exploitation of the vulnerability in the customer’s specific environment.
EPSS Score (from First.org)
Qualys TruRisk also leverages EPSS scores which predict the probability of a vulnerability being exploited in the next 30 days. Vulnerabilities with a higher EPSS score are ranked higher.
How Does Qualys TruRisk Compare Against CVSS and EPSS?
As customers adopt Qualys TruRisk to address their prioritization needs they want to know how CVSS and EPSS and TruRisk compare.
Qualys TruRisk is hyper focused on three attributes: exploit availability, evidence of exploitation in the wild, and likelihood of exploitation. This helps organizations focus on the highest risk vulnerabilities.
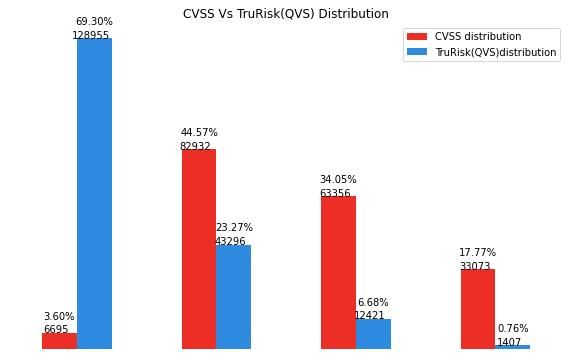
Qualys TruRisk rates less than 1% of vulnerabilities as critical, and less than 7% of vulnerabilities as high. This drastically reduces the number of vulnerabilities (up to 85% fewer compared to CVSS which ranks 51% of vulnerabilities high or critical) that organizations need to focus on to reduce risk. See Fig. 9.
Clearly organizations need to remediate other vulnerabilities as well. However, when deciding where to begin, we recommend starting with vulnerabilities that have a TruRisk-QDS risk score of 70 or higher.
Qualys Vulnerability Score (QVS) vs CVSS
Qualys TruRisk vs EPSS
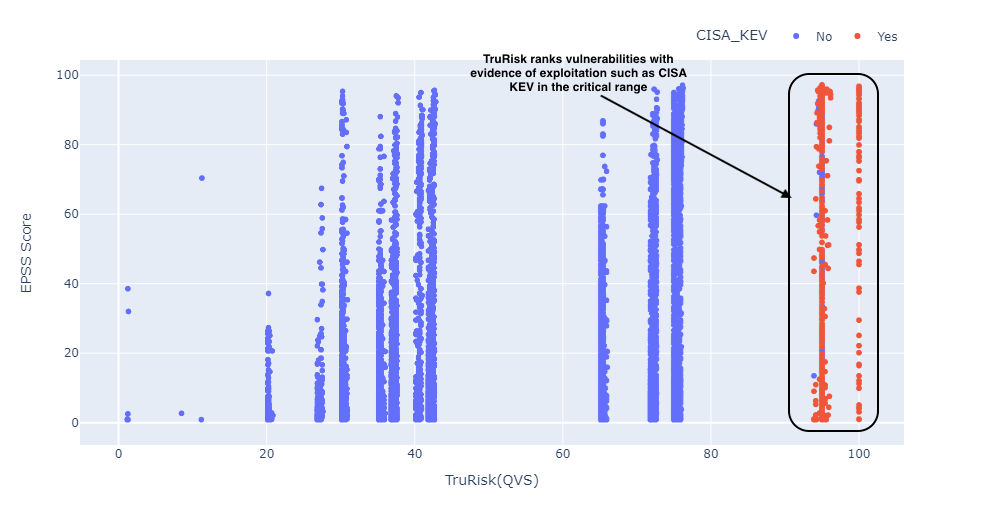
The following figure (Fig. 10) shows the distribution of EPSS scores with Qualys Vulnerability Scores (QVS) and CISA known vulnerabilities. QVS scores consistently place vulnerabilities with evidence of exploitation, such as CISA known vulnerabilities, in a higher score range even if the EPSS score is low as annotated in the figure below.
Qualys TruRisk (QVS) vs CISA KEV
Evidence of vulnerability exploitation from sources such as a CISA KEV and other threat intelligence sources tracked by the Qualys research team play a key role in determining the risk of a vulnerability.
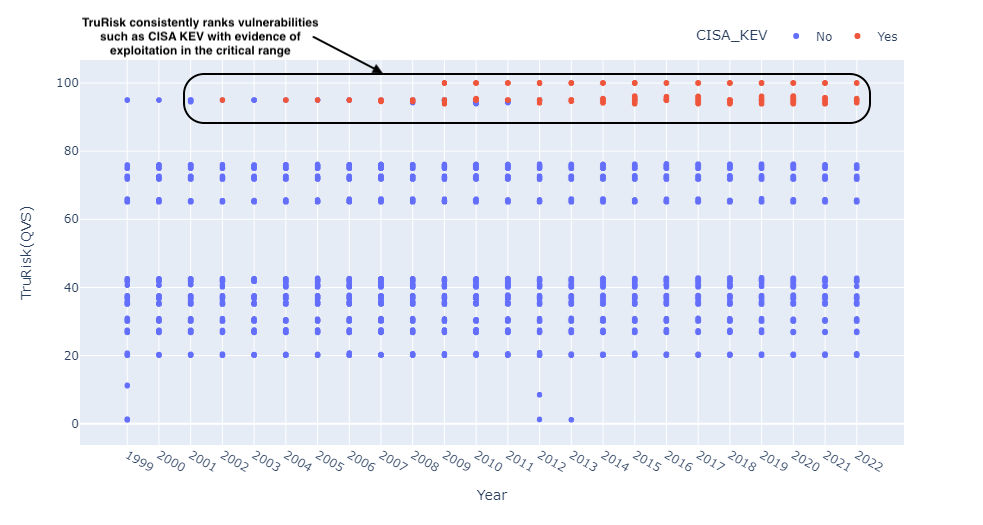
As seen below, vulnerabilities that appear in CISA Known Exploited Vulnerabilities are consistently scored higher (QVS scores of 90 or higher) by the Qualys TruRisk algorithm. (fig. 11).
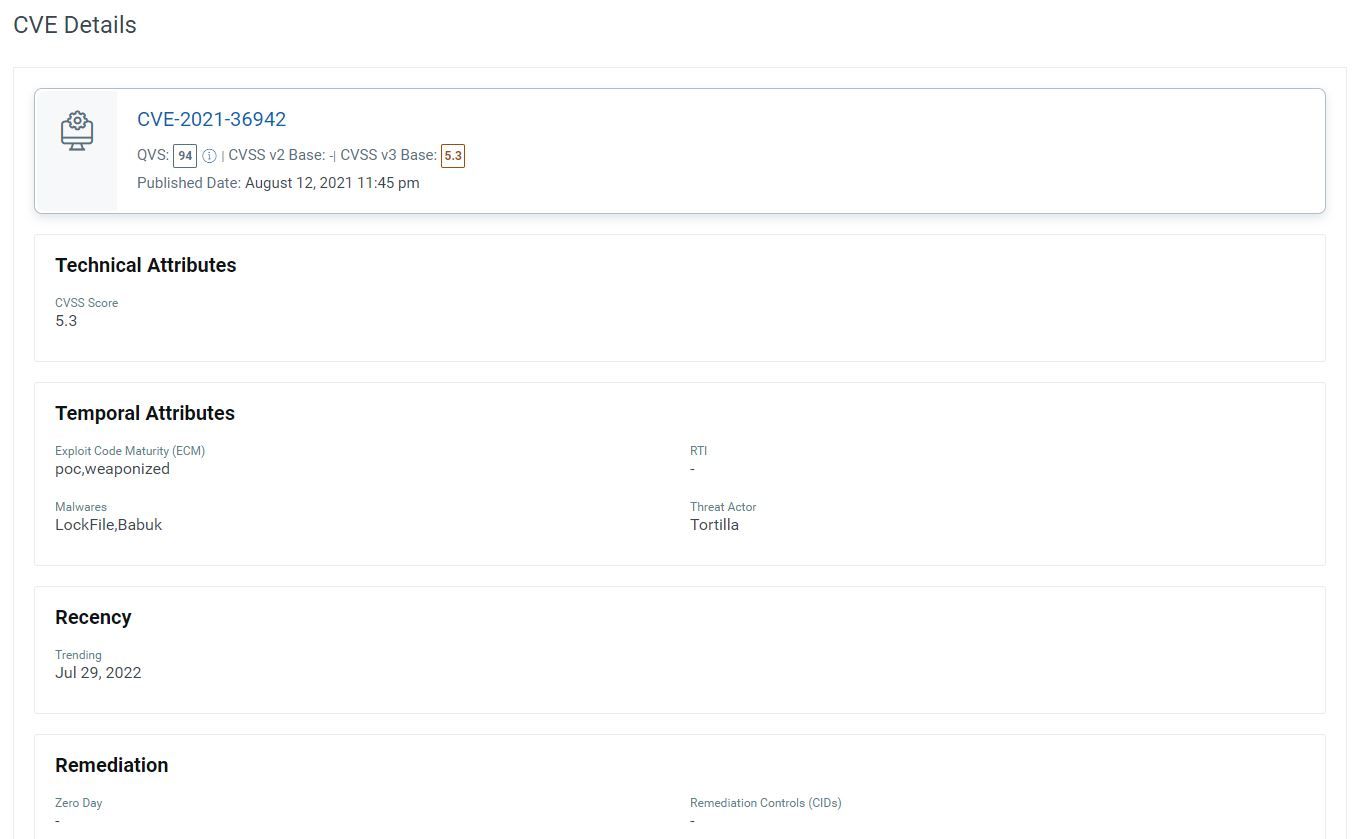
Let’s take the example of CVE-2021-36942 (the Windows LSA Spoofing Vulnerability). It is rated at 5.3 by the National Vulnerability Database (NVD), but it’s actively exploited today by malware groups and threat actors. The exploit code maturity is weaponized, making it easy for attackers to exploit the vulnerability to compromise and infect systems). Qualys TruRisk ranks CVE-2021-36942 vulnerability as critical given its exploit availability and evidence of exploitation in the wild.
How to Interpret Qualys TruRisk Scores
Qualys TruRisk builds the vulnerability risk profile of vulnerabilities, assets, and asset groups by using the following three risk scores:
Qualys Vulnerability Score (QVS) – QVS is assessed at each CVE level based on the external threat and exploit intelligence factors listed above. It is also computed for vulnerabilities that don’t have Qualys vulnerability detection signatures (QIDs). These QVS scores can be individually queried for insights from our dedicated API endpoint.
Qualys Detection Score (QDS) – QDS is assessed at each QID level. This is the score customers need to focus on for their vulnerability prioritization needs. QDS builds on the QVS score by adding two key aspects. Some QIDs can be mapped to multiple CVEs. QDS selects the highest QVS of all associated CVEs to that QID. Next, QDS accounts for any compensating/mitigation controls that are applied to an asset to reduce the risk score for a given vulnerability. For example, QDS will reduce the risk of a Remote Desktop Protocol (RDP) vulnerability if RDP is disabled.
| QDS/QVS Range | Description |
|---|---|
| >=95 | CVSS critical, exploited in the wild, has weaponized exploit available, trending risk on social media, dark web. |
| 90-95 | CVSS critical, weaponized exploit available, and evidence of exploitation by malware, threat actors/ransomware groups |
| 80-89 | CVSS Critical, weaponized exploit available, but no evidence of exploitation. CVSS Critical with evidence of exploitation, but mitigation in place. |
| 70-79 | CVSS High, weaponized exploit available, but no evidence of exploitation |
| 60-69 | CVSS critical, no exploits available |
| 50-60 | CVSS High, a Proof of Concept (PoC) exploit is available |
| 40-50 | CVSS High, no exploit available |
| 30-39 | CVSS Medium, a PoC exploit is available |
| 1-30 | CVSS Low vulnerabilities, low risk of exploitation |
Asset Risk Score (ARS)
Qualys TruRisk’s next type of risk score allows organizations to identify the riskiest assets in their organization. To assess the risk an asset poses to an organization, the Asset Risk Score considers multiple factors.
The primary factor considered by ARS is Asset Criticality, ie, what risk the asset poses based on its business value. For example: Is the asset part of a production system, a system hosting a production database, or is it purely an internal system used for development and test purposes. Production assets should be rated higher than test systems.
Qualys TruRisk determines the business criticality of the asset using multiple approaches, including:
- Manual Ratings – TruRisk allows users to set the criticality of the system by using asset tags
- Synchronization with CMDB – Most enterprises store business criticality information for assets in a configuration management database. Qualys automatically maps to CMDB data to determine the criticality of the system
- API’s – Using Qualys APIs for Asset Management and Tagging, users can assign business criticality to an asset
Finally, TruRisk analyzes the vulnerabilities found on the system and determines the asset’s risk based on the QDS scores of the vulnerabilities on an asset by a clearly defined formula called the Asset Risk Score formula.
Asset Risk Score Formula
The Asset Risk Score (ARS) is calculated using the following formula:
ARS Score = ACS Score * [wc * Avg (QDS for Critical Vuln) * f (Critical vuln count) +

    wh * Avg (QDS for High Vuln) * f (High vuln count) +

    wh * Avg (QDS for Medium Vuln) * f (Medium vuln count) +

    wh * Avg (QDS for Low Vuln) * f (Low vuln count)] * I(External)
In the above formula, ACS is Asset Criticality Score, w_are the weights fine-tuned by TruRisk algorithm to multiply each of the severity, function f (), is a non-linear function that increases exponentially as number of vulnerabilities increases. Also, the factor I(External) is for the case where an asset is external facing or discoverable by Shodan. This factor increases the score appropriately for external facing assets.
| ARS Range | Severity | Description |
|---|---|---|
| 850-1000 | Critical | Critical asset with multiple critical or high vulnerabilities |
| 700-849 | High | High value asset with multiple number of critical or high vulnerabilities or is exposed to the internet |
| 500-699 | Medium | Moderate value asset with critical or high vulnerabilities |
| 0-499 | Low | Low value asset with multiple vulnerabilities |
Conclusion
Qualys TruRisk offers organizations a comprehensive approach to risk prioritization by considering multiple factors such as vulnerability exploitation, presence of compensating controls, asset criticality, its location (internal or external) to name a few to paint an accurate picture of organization’s TruRisk (pun intended). In this blog we did a deep-dive into one aspect of TruRisk (vulnerability prioritization) and showcased how it’s better than existing models. This blog is the first of series of blogs around TruRisk, and in subsequent blogs we will do a similar deep-dives into other aspects of TruRisk for e.g. asset risk, asset group risk, misconfigurations and many more to help organizations prioritize better based on risk.
With Qualys TruRisk we have introduced foundational building blocks for major cyber risk initiatives like peer benchmarking, risk score customization, third-party risk assessment, and many more. We are very excited about TruRisk and the benefits it provides to our customers. Stay tuned for more updates.
Additional Contributors
- Shreya Salvi, Data Scientist, Qualys
- Mehul Revankar, VP, Product Management & Engineering for VMDR, Qualys
- Payal Mehrotra, Senior Director, Product Management for CyberRisk, Qualys
Hi Amir, this a great article. Would be good to update this article as couple of points about EPSS that are incorrect. I think you used older version of EPSS. In the latest scoring system EPSS v3, EPSS scores are even more aligned to QDS.