Visualize Spectre and Meltdown Remediation with Qualys AssetView Dashboard

In order to determine the impact of Spectre/Meltdown and track remediation progress across your entire environment, it is important to visualize vulnerability detections in a dynamic dashboard. For more information on Spectre and Meltdown, please see our previous blog.
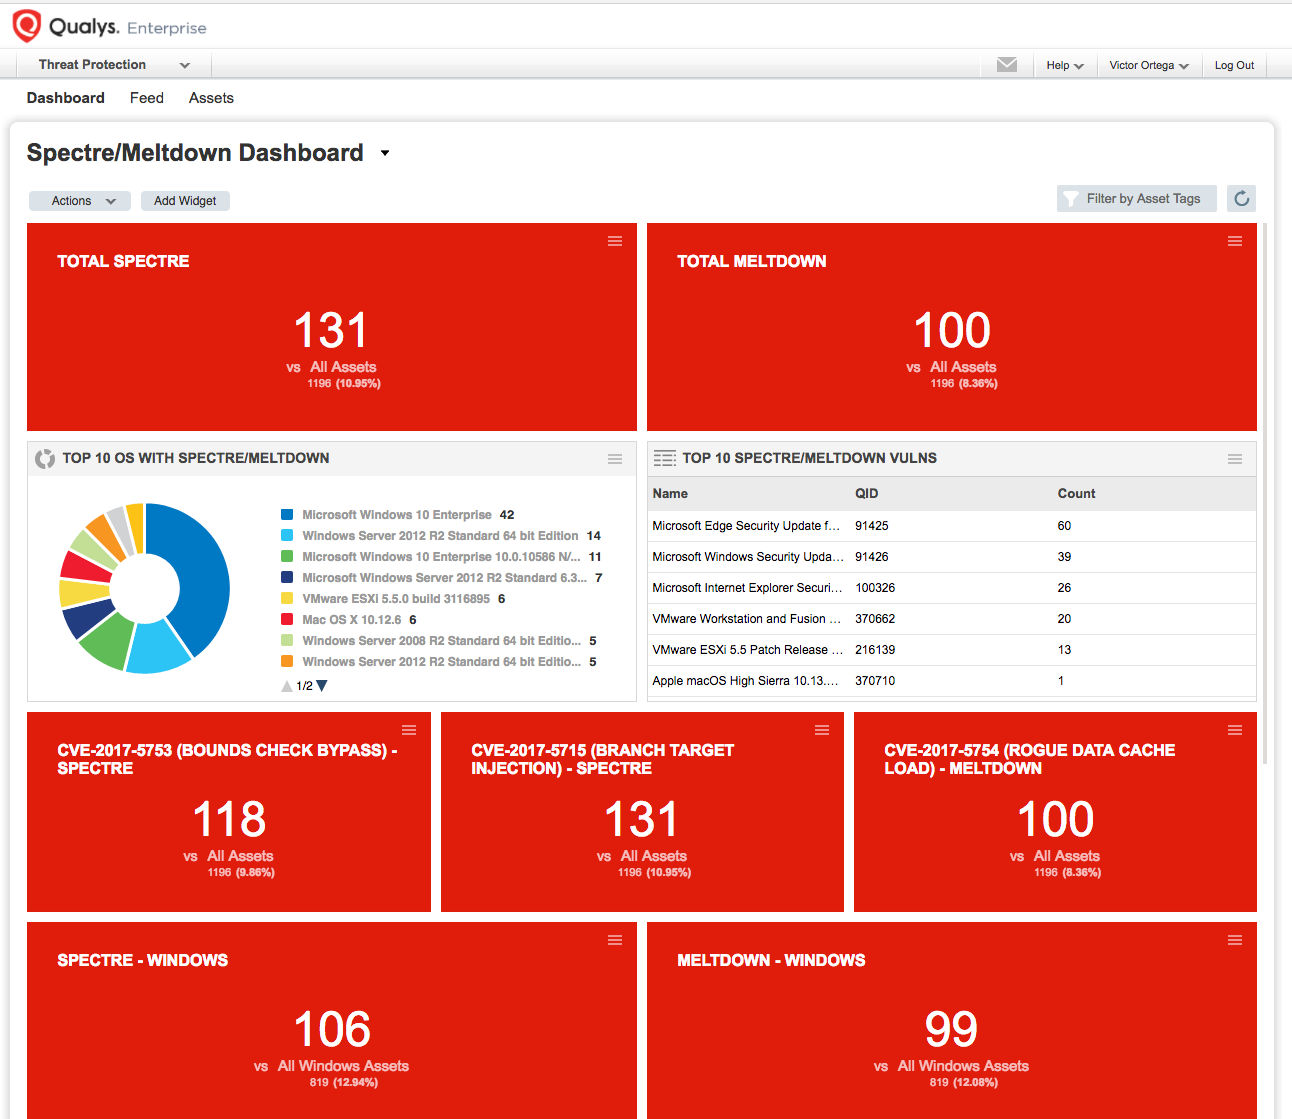
Using Qualys AssetView, we have created a dashboard with preloaded widgets that can help track remediation progress as you patch against Spectre and Meltdown. These widgets were built with out-of-the-box functionality, and can be imported into any Qualys subscription.
The dashboard file and instructions on how to import the dashboard are in this Qualys Community post.